|
Download Data (XLS File) |
|
||||||||
|
||||||||
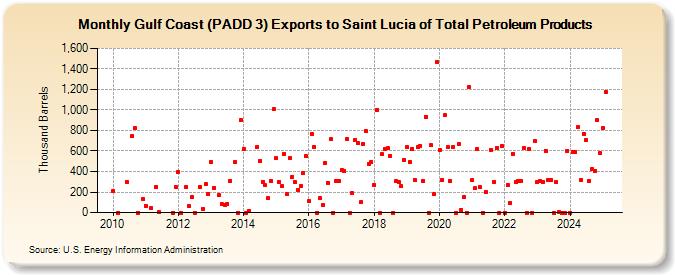
| Gulf Coast (PADD 3) Exports to Saint Lucia of Total Petroleum Products (Thousand Barrels) | ||||||||
| Year | Jan | Feb | Mar | Apr | May | Jun | Jul | Aug | Sep | Oct | Nov | Dec |
|---|---|---|---|---|---|---|---|---|---|---|---|---|
| 2010 | 210 | 0 | 301 | 745 | 823 | 0 | 130 | |||||
| 2011 | 65 | 49 | 250 | 1 | 0 | 250 | ||||||
| 2012 | 400 | 0 | 250 | 60 | 149 | 0 | 249 | 33 | 275 | 179 | ||
| 2013 | 493 | 244 | 170 | 83 | 78 | 86 | 309 | 492 | 0 | 900 | ||
| 2014 | 620 | 0 | 19 | 641 | 507 | 302 | 264 | 138 | 312 | 1,005 | ||
| 2015 | 529 | 299 | 256 | 571 | 183 | 527 | 349 | 294 | 220 | 261 | 387 | 547 |
| 2016 | 109 | 768 | 641 | 0 | 138 | 75 | 486 | 292 | 716 | 0 | 306 | 306 |
| 2017 | 417 | 405 | 718 | 0 | 190 | 712 | 676 | 100 | 670 | 792 | 471 | 492 |
| 2018 | 271 | 1,002 | 0 | 568 | 620 | 625 | 556 | 0 | 305 | 295 | 255 | 517 |
| 2019 | 637 | 493 | 622 | 318 | 638 | 649 | 308 | 936 | 0 | 655 | 177 | 1,467 |
| 2020 | 611 | 321 | 946 | 636 | 306 | 641 | 0 | 669 | 28 | 149 | 0 | 1,221 |
| 2021 | 316 | 236 | 616 | 245 | 0 | 200 | 614 | 302 | 631 | 0 | 647 | |
| 2022 | 0 | 270 | 94 | 573 | 300 | 310 | 305 | 628 | 0 | 616 | 0 | 695 |
| 2023 | 302 | 316 | 298 | 297 | 314 | 315 | 0 | 300 | 1 | 0 | 0 | 600 |
| 2024 | 0 | |||||||||||
| - = No Data Reported; -- = Not Applicable; NA = Not Available; W = Withheld to avoid disclosure of individual company data. |
| Release Date: 3/29/2024 |
| Next Release Date: 4/30/2024 |