|
Download Data (XLS File) |
|
||||||||
|
||||||||
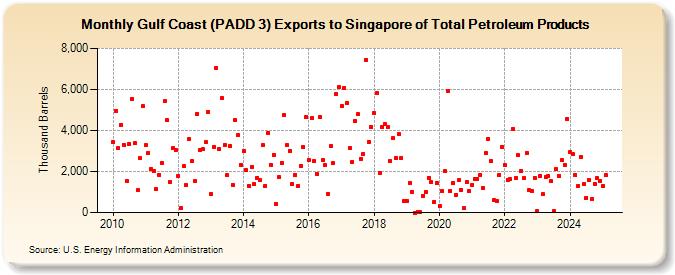
| Gulf Coast (PADD 3) Exports to Singapore of Total Petroleum Products (Thousand Barrels) | ||||||||
| Year | Jan | Feb | Mar | Apr | May | Jun | Jul | Aug | Sep | Oct | Nov | Dec |
|---|---|---|---|---|---|---|---|---|---|---|---|---|
| 2010 | 3,429 | 4,972 | 3,158 | 4,277 | 3,312 | 1,517 | 3,340 | 5,558 | 3,369 | 1,078 | 2,636 | 5,180 |
| 2011 | 3,275 | 2,914 | 2,128 | 2,014 | 1,145 | 1,847 | 2,425 | 5,422 | 4,494 | 1,496 | 3,133 | 3,032 |
| 2012 | 1,788 | 216 | 2,260 | 1,333 | 3,595 | 2,498 | 1,517 | 4,822 | 3,057 | 3,075 | 3,419 | 4,912 |
| 2013 | 889 | 3,217 | 7,062 | 3,080 | 5,595 | 3,309 | 1,812 | 3,255 | 1,347 | 4,493 | 3,764 | 2,336 |
| 2014 | 3,009 | 2,051 | 1,297 | 2,232 | 1,402 | 1,700 | 1,593 | 3,287 | 1,304 | 3,892 | 2,319 | 2,828 |
| 2015 | 407 | 1,712 | 2,431 | 4,761 | 3,302 | 2,997 | 1,394 | 1,846 | 1,308 | 2,265 | 3,191 | 4,667 |
| 2016 | 2,554 | 4,591 | 2,498 | 1,884 | 4,655 | 2,551 | 2,311 | 924 | 3,230 | 2,404 | 5,773 | 6,099 |
| 2017 | 5,215 | 6,094 | 5,327 | 3,156 | 2,486 | 4,485 | 4,784 | 2,628 | 2,858 | 7,453 | 3,444 | 4,169 |
| 2018 | 4,846 | 5,829 | 1,922 | 4,155 | 4,316 | 4,152 | 2,512 | 3,615 | 2,649 | 3,829 | 2,655 | 564 |
| 2019 | 555 | 1,455 | 1,013 | 1 | 35 | 5 | 822 | 1,018 | 1,705 | 1,465 | 521 | 1,445 |
| 2020 | 329 | 1,059 | 2,011 | 5,927 | 1,047 | 1,436 | 877 | 1,572 | 1,100 | 200 | 1,513 | 1,034 |
| 2021 | 1,344 | 1,645 | 1,645 | 1,841 | 1,198 | 2,887 | 3,585 | 2,489 | 593 | 575 | 1,840 | 3,210 |
| 2022 | 2,315 | 1,601 | 1,623 | 4,074 | 1,705 | 2,789 | 2,036 | 1,662 | 2,914 | 1,099 | 1,072 | 1,706 |
| 2023 | 307 | 1,235 | 37 | 1,514 | 1,771 | 1,192 | 61 | 2,128 | 2,085 | 2,365 | 3,228 | 4,629 |
| 2024 | 2,966 | |||||||||||
| - = No Data Reported; -- = Not Applicable; NA = Not Available; W = Withheld to avoid disclosure of individual company data. |
| Release Date: 3/29/2024 |
| Next Release Date: 4/30/2024 |