|
Download Data (XLS File) |
|
||||||||
|
||||||||
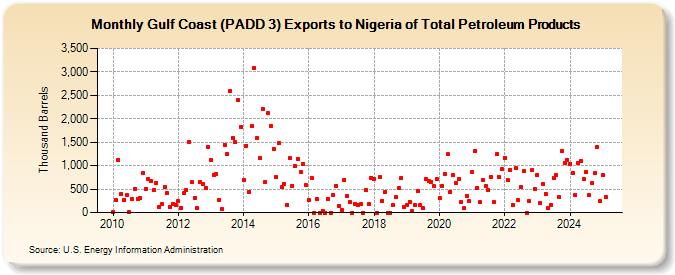
| Gulf Coast (PADD 3) Exports to Nigeria of Total Petroleum Products (Thousand Barrels) | ||||||||
| Year | Jan | Feb | Mar | Apr | May | Jun | Jul | Aug | Sep | Oct | Nov | Dec |
|---|---|---|---|---|---|---|---|---|---|---|---|---|
| 2010 | 3 | 273 | 1,131 | 392 | 264 | 366 | 2 | 286 | 507 | 279 | 307 | 841 |
| 2011 | 503 | 714 | 668 | 484 | 640 | 115 | 186 | 545 | 408 | 119 | 189 | 161 |
| 2012 | 249 | 105 | 414 | 477 | 1,514 | 644 | 309 | 88 | 641 | 610 | 520 | 1,403 |
| 2013 | 1,125 | 811 | 830 | 274 | 73 | 1,450 | 1,241 | 2,592 | 1,595 | 1,498 | 2,397 | 1,832 |
| 2014 | 685 | 1,429 | 440 | 1,855 | 3,086 | 1,594 | 1,169 | 2,218 | 650 | 2,114 | 1,852 | 1,359 |
| 2015 | 755 | 1,473 | 536 | 616 | 169 | 1,155 | 573 | 982 | 1,150 | 856 | 1,044 | 581 |
| 2016 | 266 | 738 | 0 | 293 | 0 | 37 | 0 | 297 | 0 | 375 | 574 | 143 |
| 2017 | 59 | 700 | 358 | 227 | 0 | 177 | 170 | 178 | 0 | 477 | 174 | 738 |
| 2018 | 717 | 0 | 753 | 252 | 440 | 0 | 1 | 159 | 331 | 515 | 735 | 126 |
| 2019 | 160 | 232 | 33 | 171 | 467 | 152 | 88 | 711 | 676 | 654 | 559 | 707 |
| 2020 | 310 | 565 | 826 | 1,241 | 448 | 792 | 625 | 726 | 221 | 91 | 362 | 241 |
| 2021 | 867 | 1,321 | 531 | 221 | 698 | 561 | 480 | 764 | 223 | 1,245 | 748 | 926 |
| 2022 | 1,172 | 691 | 914 | 153 | 946 | 260 | 537 | 884 | 0 | 239 | 906 | 509 |
| 2023 | 802 | 199 | 612 | 401 | 90 | 164 | 1,081 | 554 | 327 | 1,318 | 1,051 | 1,124 |
| 2024 | 1,032 | |||||||||||
| - = No Data Reported; -- = Not Applicable; NA = Not Available; W = Withheld to avoid disclosure of individual company data. |
| Release Date: 3/29/2024 |
| Next Release Date: 4/30/2024 |