|
Download Data (XLS File) |
|
||||||||
|
||||||||
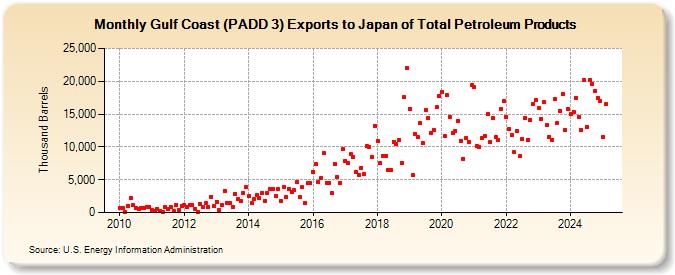
| Gulf Coast (PADD 3) Exports to Japan of Total Petroleum Products (Thousand Barrels) | ||||||||
| Year | Jan | Feb | Mar | Apr | May | Jun | Jul | Aug | Sep | Oct | Nov | Dec |
|---|---|---|---|---|---|---|---|---|---|---|---|---|
| 2010 | 760 | 666 | 67 | 1,048 | 2,198 | 1,098 | 713 | 583 | 744 | 660 | 893 | 912 |
| 2011 | 348 | 301 | 545 | 255 | 47 | 814 | 544 | 817 | 273 | 1,146 | 392 | 1,002 |
| 2012 | 1,118 | 826 | 1,107 | 1,118 | 584 | 12 | 1,349 | 837 | 1,397 | 872 | 2,408 | 948 |
| 2013 | 1,669 | 322 | 1,126 | 3,337 | 1,447 | 1,423 | 863 | 2,869 | 2,102 | 1,833 | 2,993 | 3,868 |
| 2014 | 2,478 | 1,471 | 2,023 | 2,643 | 2,163 | 2,985 | 1,776 | 2,970 | 3,615 | 3,563 | 2,458 | 3,597 |
| 2015 | 1,811 | 3,893 | 2,371 | 3,631 | 3,194 | 3,360 | 4,728 | 2,315 | 3,828 | 1,454 | 4,463 | 4,450 |
| 2016 | 6,232 | 7,344 | 4,634 | 5,206 | 9,014 | 4,574 | 4,540 | 2,951 | 7,322 | 5,429 | 4,492 | 9,636 |
| 2017 | 7,816 | 7,575 | 8,906 | 8,473 | 6,235 | 5,739 | 6,811 | 5,906 | 10,158 | 9,971 | 8,407 | 13,239 |
| 2018 | 10,938 | 7,503 | 8,635 | 8,595 | 6,446 | 6,433 | 10,786 | 10,399 | 11,064 | 7,581 | 17,541 | 21,959 |
| 2019 | 15,832 | 5,657 | 12,038 | 11,532 | 13,604 | 10,554 | 15,650 | 14,407 | 12,104 | 12,633 | 16,042 | 17,794 |
| 2020 | 18,360 | 11,708 | 17,895 | 14,597 | 12,132 | 12,475 | 13,950 | 10,938 | 8,216 | 11,295 | 10,794 | 19,367 |
| 2021 | 19,053 | 10,173 | 9,961 | 11,409 | 11,661 | 15,033 | 10,812 | 14,344 | 11,469 | 11,055 | 15,711 | 16,961 |
| 2022 | 14,612 | 12,715 | 11,742 | 9,158 | 12,440 | 8,549 | 11,202 | 14,446 | 11,058 | 14,168 | 16,469 | 17,098 |
| 2023 | 17,170 | 15,447 | 18,027 | 12,022 | 11,637 | 12,509 | 18,225 | 15,426 | 16,818 | 19,117 | 14,350 | 16,771 |
| 2024 | 14,960 | |||||||||||
| - = No Data Reported; -- = Not Applicable; NA = Not Available; W = Withheld to avoid disclosure of individual company data. |
| Release Date: 3/29/2024 |
| Next Release Date: 4/30/2024 |