|
Download Data (XLS File) |
|
||||||||
|
||||||||
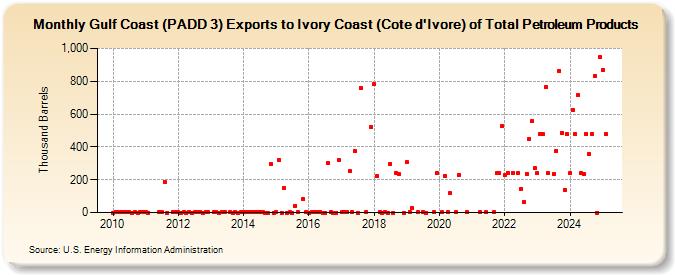
| Gulf Coast (PADD 3) Exports to Ivory Coast (Cote d'Ivore) of Total Petroleum Products (Thousand Barrels) | ||||||||
| Year | Jan | Feb | Mar | Apr | May | Jun | Jul | Aug | Sep | Oct | Nov | Dec |
|---|---|---|---|---|---|---|---|---|---|---|---|---|
| 2010 | 0 | 2 | 1 | 1 | 1 | 1 | 1 | 0 | 1 | 0 | 1 | 1 |
| 2011 | 1 | 0 | 1 | 1 | 184 | 0 | 1 | 1 | ||||
| 2012 | 1 | 0 | 2 | 0 | 1 | 0 | 1 | 1 | 1 | 0 | 1 | 1 |
| 2013 | 1 | 1 | 0 | 1 | 1 | 2 | 0 | 1 | 0 | 1 | ||
| 2014 | 2 | 1 | 1 | 1 | 1 | 2 | 1 | 1 | 0 | 0 | 294 | 0 |
| 2015 | 1 | 322 | 0 | 147 | 0 | 3 | 0 | 42 | 1 | 80 | 1 | |
| 2016 | 0 | 1 | 2 | 1 | 1 | 0 | 0 | 300 | 1 | 0 | 0 | 319 |
| 2017 | 1 | 1 | 2 | 251 | 1 | 376 | 0 | 761 | 2 | 522 | ||
| 2018 | 782 | 222 | 1 | 0 | 2 | 0 | 296 | 0 | 243 | 233 | 0 | |
| 2019 | 305 | 2 | 27 | 1 | 3 | 0 | 1 | 241 | ||||
| 2020 | 1 | 223 | 1 | 117 | 1 | 230 | 1 | |||||
| 2021 | 1 | 1 | 1 | 239 | 240 | 526 | ||||||
| 2022 | 226 | 242 | 242 | 241 | 145 | 65 | 237 | 451 | 557 | 269 | ||
| 2023 | 239 | 479 | 478 | 764 | 240 | 236 | 378 | 865 | 487 | 140 | 476 | |
| 2024 | 238 | 625 | 477 | 717 | 240 | 235 | ||||||
| - = No Data Reported; -- = Not Applicable; NA = Not Available; W = Withheld to avoid disclosure of individual company data. |
| Release Date: 8/30/2024 |
| Next Release Date: 9/30/2024 |