|
Download Data (XLS File) |
|
||||||||
|
||||||||
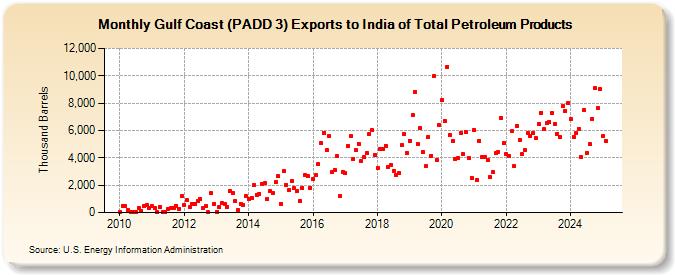
| Gulf Coast (PADD 3) Exports to India of Total Petroleum Products (Thousand Barrels) | ||||||||
| Year | Jan | Feb | Mar | Apr | May | Jun | Jul | Aug | Sep | Oct | Nov | Dec |
|---|---|---|---|---|---|---|---|---|---|---|---|---|
| 2010 | 41 | 483 | 451 | 176 | 34 | 10 | 43 | 355 | 135 | 488 | 535 | 355 |
| 2011 | 455 | 297 | 40 | 430 | 33 | 19 | 280 | 308 | 337 | 508 | 287 | 1,201 |
| 2012 | 549 | 884 | 399 | 644 | 603 | 833 | 992 | 364 | 493 | 19 | 1,401 | 658 |
| 2013 | 58 | 400 | 696 | 632 | 427 | 1,559 | 1,424 | 834 | 198 | 658 | 570 | 1,223 |
| 2014 | 1,007 | 1,087 | 2,000 | 1,319 | 1,392 | 2,104 | 2,140 | 982 | 1,543 | 1,403 | 2,218 | 2,657 |
| 2015 | 660 | 3,024 | 2,037 | 1,635 | 2,324 | 1,790 | 1,571 | 878 | 1,816 | 2,757 | 2,665 | 1,815 |
| 2016 | 2,450 | 2,717 | 3,547 | 5,078 | 5,834 | 4,551 | 5,593 | 2,998 | 3,115 | 4,105 | 1,178 | 3,001 |
| 2017 | 2,873 | 4,887 | 5,583 | 3,880 | 4,552 | 5,046 | 3,755 | 4,060 | 4,375 | 5,764 | 6,003 | 4,217 |
| 2018 | 3,277 | 4,644 | 4,670 | 4,892 | 3,361 | 3,491 | 3,073 | 2,723 | 2,891 | 4,933 | 5,711 | 4,370 |
| 2019 | 5,261 | 7,146 | 8,844 | 5,041 | 6,167 | 4,423 | 3,371 | 5,530 | 4,168 | 9,946 | 3,874 | 6,374 |
| 2020 | 8,224 | 6,693 | 10,664 | 5,702 | 5,239 | 3,931 | 3,985 | 5,819 | 4,276 | 5,852 | 3,961 | 2,549 |
| 2021 | 6,060 | 2,391 | 5,255 | 4,060 | 4,043 | 3,851 | 2,584 | 2,947 | 4,348 | 4,435 | 6,941 | 5,065 |
| 2022 | 4,276 | 4,142 | 5,926 | 3,384 | 6,333 | 5,329 | 4,257 | 4,542 | 5,831 | 5,568 | 5,839 | 5,435 |
| 2023 | 5,725 | 7,651 | 6,562 | 6,683 | 6,421 | 7,398 | 6,355 | 5,264 | 5,750 | 7,436 | 7,037 | 7,971 |
| 2024 | 6,825 | |||||||||||
| - = No Data Reported; -- = Not Applicable; NA = Not Available; W = Withheld to avoid disclosure of individual company data. |
| Release Date: 3/29/2024 |
| Next Release Date: 4/30/2024 |