|
Download Data (XLS File) |
|
||||||||
|
||||||||
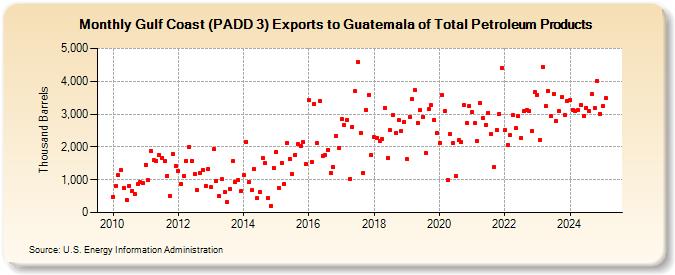
| Gulf Coast (PADD 3) Exports to Guatemala of Total Petroleum Products (Thousand Barrels) | ||||||||
| Year | Jan | Feb | Mar | Apr | May | Jun | Jul | Aug | Sep | Oct | Nov | Dec |
|---|---|---|---|---|---|---|---|---|---|---|---|---|
| 2010 | 484 | 803 | 1,139 | 1,286 | 753 | 397 | 823 | 649 | 565 | 862 | 922 | 893 |
| 2011 | 1,457 | 987 | 1,874 | 1,591 | 1,578 | 1,767 | 1,670 | 1,572 | 1,123 | 513 | 1,783 | 1,414 |
| 2012 | 1,262 | 874 | 1,114 | 1,575 | 1,998 | 1,581 | 1,188 | 674 | 1,213 | 1,311 | 820 | 1,329 |
| 2013 | 774 | 1,934 | 960 | 496 | 1,009 | 622 | 312 | 728 | 1,564 | 924 | 998 | 644 |
| 2014 | 1,133 | 2,149 | 917 | 675 | 1,325 | 433 | 631 | 1,663 | 1,501 | 442 | 209 | 1,371 |
| 2015 | 1,848 | 753 | 1,520 | 864 | 2,132 | 1,636 | 1,168 | 1,765 | 2,088 | 2,019 | 2,146 | 1,468 |
| 2016 | 3,427 | 1,552 | 3,308 | 2,104 | 3,396 | 1,734 | 1,739 | 1,914 | 1,215 | 1,382 | 2,346 | 1,963 |
| 2017 | 2,835 | 2,669 | 2,831 | 1,021 | 2,611 | 3,693 | 4,595 | 2,426 | 1,209 | 3,133 | 3,589 | 1,765 |
| 2018 | 2,291 | 2,280 | 2,192 | 2,242 | 3,194 | 1,663 | 2,502 | 2,983 | 2,417 | 2,815 | 2,484 | 2,773 |
| 2019 | 1,621 | 2,916 | 3,465 | 3,729 | 2,731 | 3,111 | 2,904 | 1,818 | 3,141 | 3,262 | 2,821 | 2,424 |
| 2020 | 2,112 | 3,587 | 3,078 | 991 | 2,389 | 2,109 | 1,100 | 2,200 | 2,138 | 3,264 | 2,733 | 3,250 |
| 2021 | 3,062 | 2,722 | 2,180 | 3,325 | 2,871 | 2,676 | 3,042 | 2,385 | 1,383 | 2,523 | 3,017 | 4,414 |
| 2022 | 2,505 | 2,066 | 2,361 | 2,965 | 2,564 | 2,944 | 2,276 | 3,082 | 3,121 | 3,103 | 2,486 | 3,662 |
| 2023 | 3,765 | 2,094 | 4,901 | 2,903 | 3,706 | 3,115 | 3,437 | 2,803 | 2,895 | 3,719 | 2,958 | 3,393 |
| 2024 | 3,435 | |||||||||||
| - = No Data Reported; -- = Not Applicable; NA = Not Available; W = Withheld to avoid disclosure of individual company data. |
| Release Date: 3/29/2024 |
| Next Release Date: 4/30/2024 |