|
Download Data (XLS File) |
|
||||||||
|
||||||||
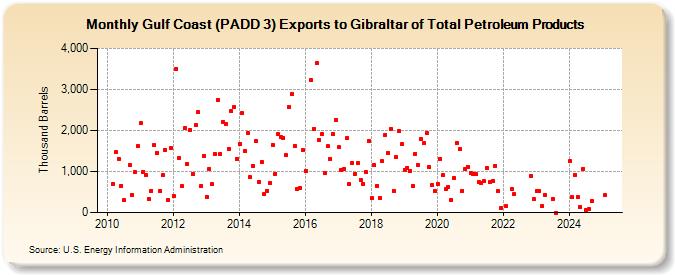
| Gulf Coast (PADD 3) Exports to Gibraltar of Total Petroleum Products (Thousand Barrels) | ||||||||
| Year | Jan | Feb | Mar | Apr | May | Jun | Jul | Aug | Sep | Oct | Nov | Dec |
|---|---|---|---|---|---|---|---|---|---|---|---|---|
| 2010 | 704 | 1,467 | 1,314 | 656 | 295 | 1,154 | 439 | 979 | 1,624 | |||
| 2011 | 2,172 | 997 | 916 | 326 | 537 | 1,643 | 1,447 | 536 | 906 | 1,521 | 309 | 1,577 |
| 2012 | 405 | 3,507 | 1,322 | 635 | 2,059 | 1,193 | 2,016 | 942 | 2,126 | 2,445 | 644 | 1,378 |
| 2013 | 382 | 1,071 | 684 | 1,432 | 2,746 | 1,424 | 2,211 | 2,168 | 1,560 | 2,465 | 2,573 | 1,310 |
| 2014 | 1,676 | 2,419 | 1,501 | 1,937 | 858 | 1,134 | 1,741 | 741 | 1,238 | 458 | 534 | 721 |
| 2015 | 1,649 | 946 | 1,911 | 1,848 | 1,827 | 1,399 | 2,576 | 2,890 | 1,618 | 585 | 605 | 1,515 |
| 2016 | 1,017 | 3,225 | 2,042 | 3,634 | 1,772 | 1,904 | 956 | 1,620 | 1,312 | 1,912 | 2,261 | |
| 2017 | 1,591 | 1,042 | 1,059 | 1,806 | 685 | 1,217 | 945 | 1,213 | 799 | 707 | 983 | 1,747 |
| 2018 | 351 | 1,150 | 651 | 349 | 1,249 | 1,894 | 1,462 | 2,043 | 535 | 1,346 | 1,979 | 1,660 |
| 2019 | 1,048 | 1,096 | 1,008 | 646 | 1,436 | 1,154 | 1,793 | 1,685 | 1,940 | 1,108 | 677 | 524 |
| 2020 | 704 | 1,317 | 907 | 582 | 620 | 310 | 849 | 1,696 | 1,544 | 534 | 1,058 | 1,121 |
| 2021 | 961 | 937 | 929 | 739 | 719 | 759 | 1,092 | 742 | 763 | 1,141 | 518 | 118 |
| 2022 | 151 | 573 | 444 | 899 | 336 | |||||||
| 2023 | 528 | 529 | 158 | 276 | 330 | 581 | ||||||
| 2024 | 1,247 | |||||||||||
| - = No Data Reported; -- = Not Applicable; NA = Not Available; W = Withheld to avoid disclosure of individual company data. |
| Release Date: 3/29/2024 |
| Next Release Date: 4/30/2024 |