|
Download Data (XLS File) |
|
||||||||
|
||||||||
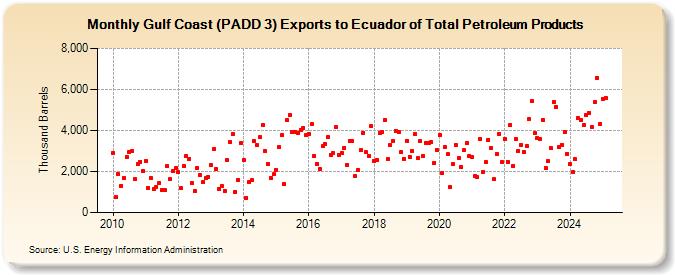
| Gulf Coast (PADD 3) Exports to Ecuador of Total Petroleum Products (Thousand Barrels) | ||||||||
| Year | Jan | Feb | Mar | Apr | May | Jun | Jul | Aug | Sep | Oct | Nov | Dec |
|---|---|---|---|---|---|---|---|---|---|---|---|---|
| 2010 | 2,923 | 767 | 1,871 | 1,310 | 1,685 | 2,715 | 2,959 | 3,001 | 1,647 | 2,364 | 2,483 | 2,014 |
| 2011 | 2,516 | 1,213 | 1,690 | 1,169 | 1,264 | 1,451 | 1,117 | 1,100 | 2,267 | 1,612 | 2,004 | 2,150 |
| 2012 | 1,960 | 1,183 | 2,263 | 2,736 | 2,634 | 1,427 | 1,053 | 2,182 | 1,852 | 1,489 | 1,680 | 1,743 |
| 2013 | 2,305 | 3,090 | 2,122 | 1,156 | 1,289 | 1,066 | 2,541 | 3,449 | 3,833 | 1,022 | 1,601 | 3,388 |
| 2014 | 2,568 | 711 | 1,465 | 1,564 | 3,479 | 3,270 | 3,668 | 4,245 | 2,985 | 2,360 | 1,682 | 1,861 |
| 2015 | 2,092 | 3,175 | 3,764 | 1,389 | 4,489 | 4,737 | 3,939 | 3,950 | 3,872 | 4,045 | 4,143 | 3,759 |
| 2016 | 3,847 | 4,297 | 2,760 | 2,368 | 2,116 | 3,221 | 3,347 | 3,673 | 2,807 | 2,898 | 4,151 | 2,818 |
| 2017 | 2,912 | 3,161 | 2,331 | 3,469 | 3,481 | 1,785 | 2,091 | 3,039 | 3,895 | 2,934 | 2,763 | 4,202 |
| 2018 | 2,508 | 2,554 | 3,894 | 3,909 | 4,514 | 2,597 | 3,286 | 3,477 | 3,969 | 3,949 | 2,930 | 2,625 |
| 2019 | 3,511 | 2,716 | 2,999 | 3,850 | 2,637 | 3,475 | 2,751 | 3,411 | 3,408 | 3,425 | 2,423 | 3,062 |
| 2020 | 3,785 | 1,915 | 3,198 | 2,835 | 1,245 | 2,357 | 3,308 | 2,637 | 2,210 | 3,047 | 3,380 | 2,775 |
| 2021 | 2,729 | 1,782 | 1,732 | 3,578 | 1,966 | 2,475 | 3,548 | 3,139 | 1,618 | 2,855 | 3,816 | 2,445 |
| 2022 | 3,603 | 2,479 | 4,258 | 2,271 | 3,593 | 2,991 | 3,306 | 2,967 | 3,247 | 4,553 | 5,424 | 3,859 |
| 2023 | 3,634 | 3,588 | 4,531 | 2,181 | 2,520 | 3,133 | 5,100 | 5,145 | 3,191 | 3,316 | 3,909 | 2,868 |
| 2024 | 2,372 | |||||||||||
| - = No Data Reported; -- = Not Applicable; NA = Not Available; W = Withheld to avoid disclosure of individual company data. |
| Release Date: 3/29/2024 |
| Next Release Date: 4/30/2024 |