|
Download Data (XLS File) |
|
||||||||
|
||||||||
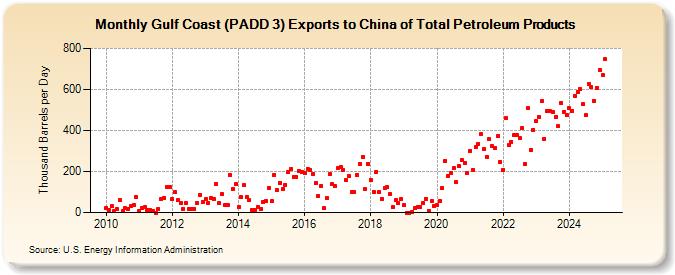
| Gulf Coast (PADD 3) Exports to China of Total Petroleum Products (Thousand Barrels per Day) | ||||||||
| Year | Jan | Feb | Mar | Apr | May | Jun | Jul | Aug | Sep | Oct | Nov | Dec |
|---|---|---|---|---|---|---|---|---|---|---|---|---|
| 2010 | 22 | 11 | 30 | 10 | 17 | 59 | 7 | 21 | 18 | 31 | 36 | 74 |
| 2011 | 10 | 21 | 25 | 13 | 13 | 9 | 0 | 17 | 64 | 72 | 125 | 123 |
| 2012 | 67 | 100 | 62 | 48 | 17 | 47 | 19 | 18 | 19 | 47 | 88 | 52 |
| 2013 | 64 | 47 | 73 | 66 | 138 | 46 | 90 | 35 | 36 | 184 | 115 | 139 |
| 2014 | 26 | 74 | 133 | 78 | 60 | 14 | 13 | 26 | 19 | 52 | 56 | 120 |
| 2015 | 55 | 182 | 112 | 146 | 114 | 136 | 196 | 212 | 174 | 173 | 201 | 200 |
| 2016 | 194 | 213 | 209 | 188 | 144 | 81 | 129 | 20 | 71 | 187 | 137 | 127 |
| 2017 | 218 | 221 | 208 | 157 | 178 | 99 | 101 | 183 | 237 | 273 | 113 | 237 |
| 2018 | 160 | 101 | 200 | 101 | 67 | 120 | 124 | 90 | 26 | 60 | 46 | 65 |
| 2019 | 35 | 0 | 0 | 5 | 20 | 28 | 28 | 47 | 68 | 9 | 55 | 33 |
| 2020 | 37 | 58 | 119 | 252 | 179 | 191 | 215 | 147 | 225 | 257 | 242 | 193 |
| 2021 | 301 | 209 | 319 | 336 | 385 | 309 | 270 | 357 | 322 | 316 | 372 | 247 |
| 2022 | 209 | 459 | 327 | 346 | 377 | 377 | 364 | 412 | 236 | 508 | 307 | 403 |
| 2023 | 441 | 446 | 499 | 361 | 496 | 541 | 471 | 435 | 409 | 536 | 491 | 439 |
| 2024 | 508 | |||||||||||
| - = No Data Reported; -- = Not Applicable; NA = Not Available; W = Withheld to avoid disclosure of individual company data. |
| Release Date: 3/29/2024 |
| Next Release Date: 4/30/2024 |