|
Download Data (XLS File) |
|
||||||||
|
||||||||
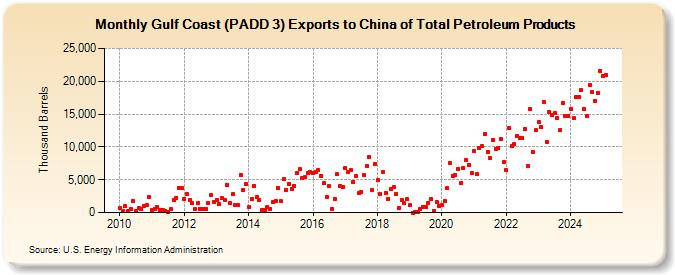
| Gulf Coast (PADD 3) Exports to China of Total Petroleum Products (Thousand Barrels) | ||||||||
| Year | Jan | Feb | Mar | Apr | May | Jun | Jul | Aug | Sep | Oct | Nov | Dec |
|---|---|---|---|---|---|---|---|---|---|---|---|---|
| 2010 | 676 | 303 | 924 | 302 | 539 | 1,773 | 203 | 643 | 550 | 964 | 1,093 | 2,298 |
| 2011 | 322 | 582 | 785 | 401 | 415 | 277 | 14 | 525 | 1,905 | 2,242 | 3,737 | 3,813 |
| 2012 | 2,078 | 2,896 | 1,924 | 1,440 | 532 | 1,401 | 579 | 560 | 555 | 1,459 | 2,629 | 1,627 |
| 2013 | 1,974 | 1,320 | 2,272 | 1,987 | 4,270 | 1,381 | 2,775 | 1,087 | 1,090 | 5,709 | 3,436 | 4,307 |
| 2014 | 803 | 2,076 | 4,117 | 2,354 | 1,874 | 415 | 406 | 802 | 579 | 1,624 | 1,691 | 3,730 |
| 2015 | 1,719 | 5,104 | 3,471 | 4,376 | 3,522 | 4,087 | 6,072 | 6,567 | 5,231 | 5,356 | 6,032 | 6,198 |
| 2016 | 6,002 | 6,178 | 6,466 | 5,641 | 4,449 | 2,421 | 4,003 | 610 | 2,128 | 5,805 | 4,105 | 3,935 |
| 2017 | 6,761 | 6,196 | 6,454 | 4,719 | 5,528 | 2,959 | 3,116 | 5,663 | 7,104 | 8,456 | 3,378 | 7,338 |
| 2018 | 4,949 | 2,822 | 6,197 | 3,021 | 2,072 | 3,612 | 3,829 | 2,785 | 766 | 1,865 | 1,385 | 2,025 |
| 2019 | 1,094 | 3 | 10 | 161 | 605 | 827 | 882 | 1,468 | 2,036 | 270 | 1,637 | 1,019 |
| 2020 | 1,149 | 1,688 | 3,677 | 7,563 | 5,561 | 5,733 | 6,676 | 4,543 | 6,761 | 7,956 | 7,250 | 5,979 |
| 2021 | 9,338 | 5,859 | 9,880 | 10,071 | 11,939 | 9,263 | 8,378 | 11,076 | 9,663 | 9,810 | 11,170 | 7,667 |
| 2022 | 6,465 | 12,858 | 10,140 | 10,390 | 11,682 | 11,300 | 11,281 | 12,781 | 7,091 | 15,743 | 9,222 | 12,508 |
| 2023 | 13,660 | 12,484 | 15,479 | 10,825 | 15,370 | 16,220 | 14,591 | 13,478 | 12,260 | 16,622 | 14,718 | 13,603 |
| 2024 | 15,753 | |||||||||||
| - = No Data Reported; -- = Not Applicable; NA = Not Available; W = Withheld to avoid disclosure of individual company data. |
| Release Date: 3/29/2024 |
| Next Release Date: 4/30/2024 |