|
Download Data (XLS File) |
|
||||||||
|
||||||||
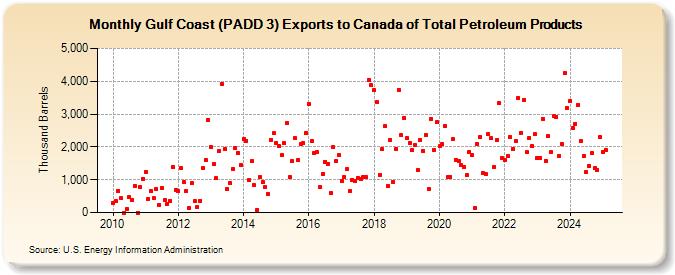
| Gulf Coast (PADD 3) Exports to Canada of Total Petroleum Products (Thousand Barrels) | ||||||||
| Year | Jan | Feb | Mar | Apr | May | Jun | Jul | Aug | Sep | Oct | Nov | Dec |
|---|---|---|---|---|---|---|---|---|---|---|---|---|
| 2010 | 300 | 352 | 660 | 440 | 0 | 106 | 464 | 378 | 809 | 0 | 776 | 1,033 |
| 2011 | 1,242 | 424 | 661 | 446 | 714 | 239 | 758 | 373 | 272 | 363 | 1,392 | 688 |
| 2012 | 657 | 1,351 | 938 | 657 | 144 | 889 | 344 | 171 | 363 | 1,356 | 1,608 | 2,831 |
| 2013 | 2,000 | 1,484 | 1,040 | 1,882 | 3,929 | 1,932 | 718 | 910 | 1,327 | 1,967 | 1,820 | 1,443 |
| 2014 | 2,253 | 2,192 | 998 | 1,569 | 830 | 79 | 1,080 | 920 | 777 | 574 | 2,219 | 2,409 |
| 2015 | 2,123 | 2,019 | 1,752 | 2,104 | 2,715 | 1,069 | 1,558 | 2,270 | 1,607 | 2,102 | 2,116 | 2,430 |
| 2016 | 3,315 | 2,191 | 1,826 | 1,844 | 768 | 1,176 | 1,555 | 1,492 | 600 | 1,987 | 1,585 | 1,757 |
| 2017 | 976 | 1,069 | 1,315 | 662 | 1,005 | 950 | 1,061 | 1,024 | 1,085 | 1,073 | 4,043 | 3,887 |
| 2018 | 3,727 | 3,356 | 1,157 | 1,934 | 2,624 | 823 | 2,218 | 942 | 1,944 | 3,742 | 2,353 | 2,892 |
| 2019 | 2,274 | 2,123 | 1,909 | 2,060 | 1,291 | 2,204 | 1,885 | 2,362 | 718 | 2,856 | 1,916 | 2,758 |
| 2020 | 2,012 | 2,093 | 2,628 | 1,084 | 1,078 | 2,228 | 1,614 | 1,570 | 1,445 | 1,392 | 1,146 | 1,851 |
| 2021 | 1,739 | 150 | 2,093 | 2,294 | 1,209 | 1,168 | 2,387 | 2,263 | 1,393 | 2,198 | 3,326 | 1,655 |
| 2022 | 1,589 | 1,720 | 2,294 | 1,943 | 2,180 | 3,484 | 2,429 | 3,435 | 1,834 | 2,270 | 2,016 | 2,379 |
| 2023 | 1,663 | 1,664 | 2,870 | 1,550 | 2,236 | 1,754 | 2,927 | 2,918 | 1,728 | 2,095 | 4,249 | 3,186 |
| 2024 | 3,402 | |||||||||||
| - = No Data Reported; -- = Not Applicable; NA = Not Available; W = Withheld to avoid disclosure of individual company data. |
| Release Date: 3/29/2024 |
| Next Release Date: 4/30/2024 |