|
Download Data (XLS File) |
|
||||||||
|
||||||||
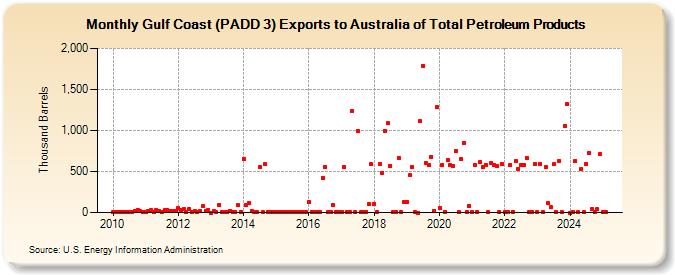
| Gulf Coast (PADD 3) Exports to Australia of Total Petroleum Products (Thousand Barrels) | ||||||||
| Year | Jan | Feb | Mar | Apr | May | Jun | Jul | Aug | Sep | Oct | Nov | Dec |
|---|---|---|---|---|---|---|---|---|---|---|---|---|
| 2010 | 7 | 2 | 8 | 7 | 1 | 4 | 8 | 2 | 24 | 36 | 14 | 1 |
| 2011 | 11 | 15 | 28 | 1 | 26 | 14 | 9 | 30 | 34 | 25 | 23 | 15 |
| 2012 | 58 | 31 | 42 | 5 | 48 | 1 | 19 | 1 | 16 | 75 | 23 | 36 |
| 2013 | 0 | 21 | 1 | 97 | 1 | 3 | 8 | 25 | 7 | 7 | 89 | 1 |
| 2014 | 658 | 97 | 121 | 22 | 3 | 6 | 554 | 1 | 587 | 10 | 1 | 3 |
| 2015 | 1 | 8 | 1 | 1 | 10 | 1 | 2 | 2 | 2 | 1 | 2 | 2 |
| 2016 | 132 | 2 | 1 | 1 | 3 | 427 | 557 | 1 | 1 | 87 | 1 | 2 |
| 2017 | 1 | 551 | 3 | 1 | 1,234 | 2 | 999 | 1 | 1 | 1 | 104 | 587 |
| 2018 | 110 | 2 | 588 | 487 | 998 | 1,091 | 572 | 1 | 1 | 668 | 1 | 123 |
| 2019 | 134 | 457 | 551 | 4 | 0 | 1,110 | 1,788 | 609 | 575 | 680 | 16 | 1,280 |
| 2020 | 55 | 582 | 4 | 640 | 576 | 573 | 744 | 6 | 647 | 849 | 6 | 83 |
| 2021 | 1 | 577 | 5 | 616 | 555 | 585 | 5 | 607 | 579 | 573 | 4 | 586 |
| 2022 | 3 | 6 | 580 | 7 | 629 | 536 | 583 | 580 | 664 | 3 | 1 | 590 |
| 2023 | 2 | 559 | 1 | 551 | 700 | 62 | 591 | 2 | 634 | 111 | 1,378 | 1,320 |
| 2024 | 0 | |||||||||||
| - = No Data Reported; -- = Not Applicable; NA = Not Available; W = Withheld to avoid disclosure of individual company data. |
| Release Date: 3/29/2024 |
| Next Release Date: 4/30/2024 |