|
Download Data (XLS File) |
|
||||||||
|
||||||||
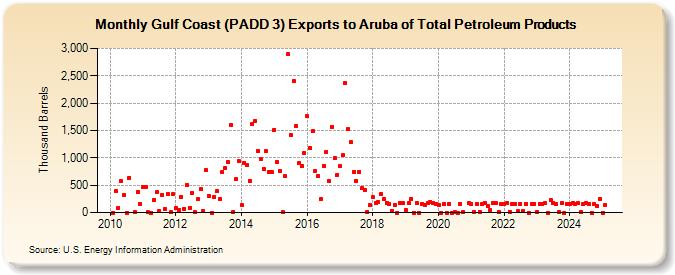
| Gulf Coast (PADD 3) Exports to Aruba of Total Petroleum Products (Thousand Barrels) | ||||||||
| Year | Jan | Feb | Mar | Apr | May | Jun | Jul | Aug | Sep | Oct | Nov | Dec |
|---|---|---|---|---|---|---|---|---|---|---|---|---|
| 2010 | 0 | 393 | 92 | 571 | 326 | 0 | 638 | 5 | 384 | 160 | ||
| 2011 | 471 | 465 | 2 | 0 | 237 | 374 | 31 | 330 | 60 | 346 | 2 | 331 |
| 2012 | 85 | 55 | 293 | 70 | 497 | 87 | 357 | 8 | 247 | 435 | 26 | 773 |
| 2013 | 304 | 0 | 288 | 386 | 240 | 743 | 818 | 928 | 1,600 | 18 | 605 | 936 |
| 2014 | 141 | 902 | 861 | 577 | 1,627 | 1,675 | 1,129 | 979 | 796 | 1,118 | 748 | 746 |
| 2015 | 1,515 | 925 | 766 | 2 | 661 | 2,891 | 1,425 | 2,398 | 1,582 | 900 | 850 | 1,089 |
| 2016 | 1,758 | 1,172 | 1,490 | 757 | 677 | 245 | 850 | 1,113 | 568 | 1,569 | 990 | 695 |
| 2017 | 846 | 1,049 | 2,366 | 1,523 | 1,283 | 744 | 578 | 747 | 446 | 421 | 13 | 140 |
| 2018 | 277 | 176 | 191 | 339 | 249 | 183 | 153 | 35 | 144 | 1 | 166 | 166 |
| 2019 | 48 | 174 | 251 | 1 | 175 | 0 | 161 | 140 | 169 | 198 | 166 | 162 |
| 2020 | 141 | 1 | 159 | 1 | 160 | 0 | 10 | 0 | 161 | 14 | 174 | |
| 2021 | 160 | 14 | 162 | 15 | 157 | 181 | 118 | 46 | 176 | 171 | 14 | 160 |
| 2022 | 160 | 183 | 11 | 161 | 161 | 21 | 161 | 20 | 161 | 1 | 165 | 161 |
| 2023 | 99 | 76 | 161 | 173 | 1 | 228 | 183 | 160 | 15 | 174 | 1 | 160 |
| 2024 | 160 | |||||||||||
| - = No Data Reported; -- = Not Applicable; NA = Not Available; W = Withheld to avoid disclosure of individual company data. |
| Release Date: 3/29/2024 |
| Next Release Date: 4/30/2024 |