|
Download Data (XLS File) |
|
||||||||
|
||||||||
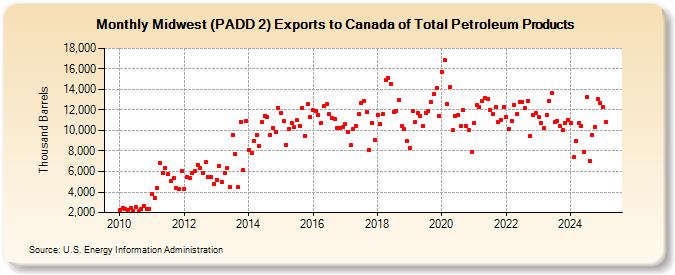
| Midwest (PADD 2) Exports to Canada of Total Petroleum Products (Thousand Barrels) | ||||||||
| Year | Jan | Feb | Mar | Apr | May | Jun | Jul | Aug | Sep | Oct | Nov | Dec |
|---|---|---|---|---|---|---|---|---|---|---|---|---|
| 2010 | 2,265 | 2,407 | 2,335 | 2,282 | 2,459 | 2,178 | 2,511 | 2,111 | 2,318 | 2,626 | 2,328 | 2,364 |
| 2011 | 3,814 | 3,451 | 4,374 | 6,808 | 5,807 | 6,324 | 5,719 | 5,093 | 5,367 | 4,370 | 4,252 | 6,035 |
| 2012 | 4,335 | 5,452 | 5,416 | 5,876 | 6,074 | 6,635 | 6,327 | 5,817 | 6,890 | 5,454 | 5,426 | 4,766 |
| 2013 | 5,222 | 6,585 | 4,991 | 5,809 | 6,377 | 4,468 | 9,538 | 7,720 | 4,450 | 10,833 | 6,113 | 10,961 |
| 2014 | 8,087 | 7,834 | 8,979 | 9,596 | 8,534 | 10,817 | 11,458 | 11,318 | 9,599 | 10,284 | 9,858 | 12,226 |
| 2015 | 11,727 | 10,883 | 8,606 | 10,188 | 10,714 | 10,309 | 10,990 | 10,461 | 12,200 | 9,510 | 12,562 | 11,326 |
| 2016 | 11,957 | 11,896 | 11,523 | 10,772 | 12,365 | 12,554 | 11,591 | 11,199 | 11,101 | 10,280 | 10,247 | 10,297 |
| 2017 | 10,635 | 9,839 | 8,586 | 10,123 | 10,460 | 11,560 | 12,654 | 12,849 | 11,822 | 8,051 | 10,737 | 9,061 |
| 2018 | 11,547 | 10,608 | 11,565 | 14,873 | 15,146 | 14,560 | 11,805 | 11,935 | 12,954 | 10,414 | 10,142 | 8,966 |
| 2019 | 8,268 | 11,866 | 10,788 | 11,668 | 11,407 | 10,447 | 11,740 | 11,902 | 12,776 | 13,586 | 14,169 | 11,418 |
| 2020 | 15,679 | 16,878 | 12,541 | 14,195 | 10,013 | 11,442 | 11,532 | 10,399 | 11,975 | 10,480 | 10,017 | 7,914 |
| 2021 | 10,776 | 12,469 | 12,255 | 12,849 | 13,148 | 13,089 | 12,021 | 11,653 | 12,298 | 10,812 | 11,054 | 12,314 |
| 2022 | 11,348 | 10,152 | 10,903 | 12,524 | 11,586 | 12,791 | 12,773 | 12,169 | 12,904 | 9,480 | 11,531 | 11,677 |
| 2023 | 11,085 | 10,316 | 10,133 | 11,490 | 9,157 | 10,410 | 8,747 | 8,117 | 8,034 | 7,679 | 10,745 | 10,921 |
| 2024 | 10,719 | |||||||||||
| - = No Data Reported; -- = Not Applicable; NA = Not Available; W = Withheld to avoid disclosure of individual company data. |
| Release Date: 3/29/2024 |
| Next Release Date: 4/30/2024 |