|
Download Data (XLS File) |
|
||||||||
|
||||||||
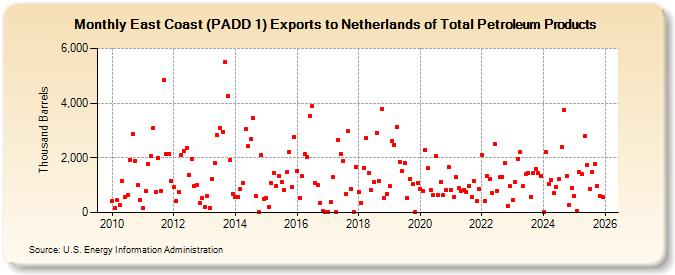
| East Coast (PADD 1) Exports to Netherlands of Total Petroleum Products (Thousand Barrels) | ||||||||
| Year | Jan | Feb | Mar | Apr | May | Jun | Jul | Aug | Sep | Oct | Nov | Dec |
|---|---|---|---|---|---|---|---|---|---|---|---|---|
| 2010 | 433 | 154 | 466 | 275 | 1,143 | 556 | 627 | 1,928 | 2,860 | 1,892 | 1,018 | 472 |
| 2011 | 154 | 803 | 1,779 | 2,058 | 3,086 | 742 | 1,980 | 787 | 4,843 | 2,140 | 2,150 | 1,151 |
| 2012 | 916 | 420 | 736 | 2,101 | 2,260 | 2,374 | 1,365 | 1,955 | 957 | 1,002 | 362 | 530 |
| 2013 | 185 | 587 | 168 | 1,234 | 1,817 | 2,824 | 3,087 | 2,951 | 5,511 | 4,255 | 1,915 | 691 |
| 2014 | 551 | 585 | 843 | 1,097 | 3,039 | 2,430 | 2,693 | 3,457 | 610 | 29 | 2,111 | 505 |
| 2015 | 516 | 210 | 1,069 | 1,464 | 976 | 1,352 | 1,122 | 842 | 1,474 | 2,198 | 932 | 2,778 |
| 2016 | 1,525 | 540 | 1,326 | 2,131 | 2,033 | 3,511 | 3,890 | 1,096 | 991 | 353 | 46 | 27 |
| 2017 | 32 | 398 | 1,285 | 13 | 2,635 | 2,152 | 1,898 | 676 | 2,965 | 873 | 27 | 1,657 |
| 2018 | 746 | 352 | 1,634 | 2,735 | 1,447 | 810 | 1,120 | 2,911 | 1,144 | 3,798 | 531 | 680 |
| 2019 | 953 | 2,610 | 2,482 | 3,125 | 1,861 | 1,520 | 1,827 | 541 | 1,230 | 1,026 | 15 | 1,077 |
| 2020 | 851 | 796 | 2,296 | 1,620 | 819 | 648 | 2,067 | 639 | 1,130 | 656 | 808 | 1,666 |
| 2021 | 823 | 569 | 1,282 | 897 | 794 | 834 | 740 | 988 | 567 | 1,141 | 416 | 847 |
| 2022 | 2,110 | 423 | 1,337 | 1,213 | 710 | 2,520 | 789 | 1,283 | 1,310 | 1,815 | 235 | 964 |
| 2023 | 471 | 1,125 | 2,298 | 2,585 | 692 | 1,393 | 1,810 | 583 | 1,456 | 1,597 | 1,442 | 1,347 |
| 2024 | 181 | |||||||||||
| - = No Data Reported; -- = Not Applicable; NA = Not Available; W = Withheld to avoid disclosure of individual company data. |
| Release Date: 3/29/2024 |
| Next Release Date: 4/30/2024 |