|
Download Data (XLS File) |
|
||||||||
|
||||||||
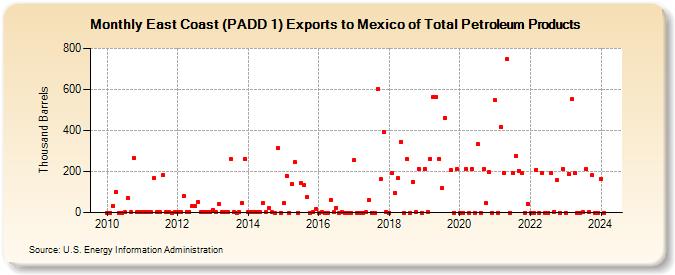
| East Coast (PADD 1) Exports to Mexico of Total Petroleum Products (Thousand Barrels) | ||||||||
| Year | Jan | Feb | Mar | Apr | May | Jun | Jul | Aug | Sep | Oct | Nov | Dec |
|---|---|---|---|---|---|---|---|---|---|---|---|---|
| 2010 | 0 | 0 | 32 | 101 | 0 | 0 | 1 | 71 | 1 | 266 | 1 | 1 |
| 2011 | 1 | 1 | 2 | 1 | 168 | 1 | 1 | 181 | 2 | 1 | 0 | 1 |
| 2012 | 1 | 1 | 80 | 5 | 4 | 32 | 30 | 51 | 1 | 4 | 1 | 1 |
| 2013 | 14 | 1 | 43 | 1 | 1 | 1 | 261 | 1 | 0 | 1 | 47 | 261 |
| 2014 | 1 | 5 | 3 | 4 | 1 | 46 | 1 | 23 | 1 | 0 | 314 | 0 |
| 2015 | 46 | 180 | 0 | 139 | 244 | 0 | 143 | 135 | 74 | 0 | 1 | 16 |
| 2016 | 0 | 1 | 0 | 0 | 63 | 1 | 23 | 0 | 1 | 0 | 0 | 0 |
| 2017 | 256 | 0 | 0 | 0 | 1 | 61 | 0 | 0 | 602 | 162 | 394 | 3 |
| 2018 | 0 | 192 | 97 | 167 | 346 | 0 | 260 | 0 | 149 | 1 | 214 | 0 |
| 2019 | 212 | 5 | 261 | 561 | 564 | 262 | 120 | 462 | 206 | 0 | 212 | |
| 2020 | 0 | 0 | 212 | 0 | 212 | 0 | 334 | 0 | 212 | 46 | 196 | 0 |
| 2021 | 547 | 0 | 416 | 194 | 748 | 0 | 195 | 275 | 204 | 193 | 0 | 43 |
| 2022 | 0 | 0 | 209 | 0 | 193 | 0 | 0 | 194 | 4 | 157 | 0 | 210 |
| 2023 | 0 | 187 | 552 | 193 | 0 | 0 | 1 | 212 | 3 | 181 | 0 | 0 |
| 2024 | 165 | |||||||||||
| - = No Data Reported; -- = Not Applicable; NA = Not Available; W = Withheld to avoid disclosure of individual company data. |
| Release Date: 3/29/2024 |
| Next Release Date: 4/30/2024 |