|
Download Data (XLS File) |
|
||||||||
|
||||||||
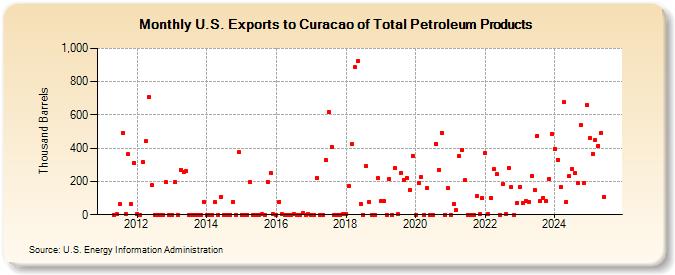
| U.S. Exports to Curacao of Total Petroleum Products (Thousand Barrels) | ||||||||
| Year | Jan | Feb | Mar | Apr | May | Jun | Jul | Aug | Sep | Oct | Nov | Dec |
|---|---|---|---|---|---|---|---|---|---|---|---|---|
| 2011 | 0 | 2 | 62 | 493 | 2 | 363 | 63 | 311 | ||||
| 2012 | 2 | 1 | 316 | 441 | 706 | 176 | 1 | 1 | 0 | 1 | 195 | 1 |
| 2013 | 1 | 196 | 1 | 270 | 257 | 264 | 0 | 0 | 1 | 0 | 1 | 78 |
| 2014 | 0 | 1 | 1 | 75 | 1 | 109 | 1 | 1 | 1 | 78 | 0 | 375 |
| 2015 | 1 | 0 | 1 | 196 | 1 | 1 | 1 | 2 | 1 | 199 | 250 | 2 |
| 2016 | 1 | 78 | 2 | 1 | 1 | 1 | 4 | 1 | 1 | 8 | 1 | 2 |
| 2017 | 1 | 1 | 220 | 1 | 1 | 329 | 619 | 409 | 1 | 1 | 1 | 2 |
| 2018 | 3 | 172 | 426 | 886 | 924 | 66 | 1 | 292 | 76 | 1 | 1 | 218 |
| 2019 | 80 | 82 | 1 | 214 | 0 | 280 | 2 | 252 | 207 | 221 | 146 | 356 |
| 2020 | 1 | 190 | 225 | 1 | 160 | 1 | 1 | 427 | 271 | 493 | 1 | 158 |
| 2021 | 1 | 67 | 28 | 352 | 392 | 206 | 1 | 1 | 1 | 110 | 2 | 101 |
| 2022 | 371 | 2 | 100 | 272 | 243 | 1 | 182 | 2 | 281 | 166 | 1 | 72 |
| 2023 | 168 | 161 | 81 | 78 | 233 | 1 | 626 | 82 | 102 | 81 | 46 | 406 |
| 2024 | 477 | |||||||||||
| - = No Data Reported; -- = Not Applicable; NA = Not Available; W = Withheld to avoid disclosure of individual company data. |
| Release Date: 3/29/2024 |
| Next Release Date: 4/30/2024 |