|
Download Data (XLS File) |
|
||||||||
|
||||||||
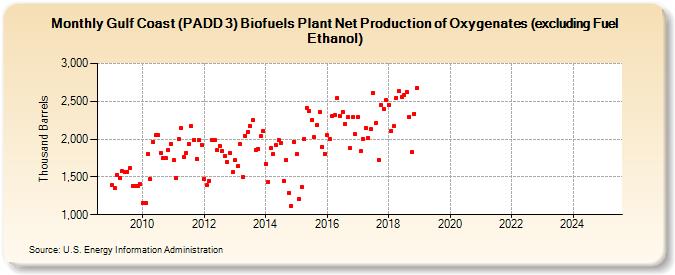
| Gulf Coast (PADD 3) Biofuels Plant Net Production of Oxygenates (excluding Fuel Ethanol) (Thousand Barrels) | ||||||||
| Year | Jan | Feb | Mar | Apr | May | Jun | Jul | Aug | Sep | Oct | Nov | Dec |
|---|---|---|---|---|---|---|---|---|---|---|---|---|
| 2009 | 1,388 | 1,353 | 1,526 | 1,485 | 1,578 | 1,561 | 1,566 | 1,620 | 1,386 | 1,380 | 1,383 | 1,404 |
| 2010 | 1,153 | 1,156 | 1,809 | 1,472 | 1,966 | 2,051 | 2,048 | 1,822 | 1,749 | 1,750 | 1,860 | 1,941 |
| 2011 | 1,717 | 1,488 | 1,999 | 2,146 | 1,758 | 1,818 | 1,940 | 2,171 | 1,987 | 1,743 | 1,986 | 1,927 |
| 2012 | 1,474 | 1,388 | 1,450 | 1,983 | 1,991 | 1,852 | 1,915 | 1,844 | 1,777 | 1,696 | 1,818 | 1,559 |
| 2013 | 1,719 | 1,638 | 1,929 | 1,498 | 2,045 | 2,096 | 2,173 | 2,252 | 1,857 | 1,869 | 2,036 | 2,104 |
| 2014 | 1,670 | 1,437 | 1,877 | 1,800 | 1,919 | 1,987 | 1,944 | 1,450 | 1,730 | 1,291 | 1,117 | 1,966 |
| 2015 | 1,800 | 1,211 | 1,371 | 2,004 | 2,416 | 2,373 | 2,252 | 2,023 | 2,181 | 2,357 | 1,897 | 1,807 |
| 2016 | 2,048 | 1,997 | 2,306 | 2,315 | 2,542 | 2,310 | 2,363 | 2,202 | 2,294 | 1,881 | 2,291 | 2,062 |
| 2017 | 2,297 | 1,837 | 2,003 | 2,152 | 2,015 | 2,128 | 2,613 | 2,214 | 1,727 | 2,450 | 2,399 | 2,514 |
| 2018 | 2,452 | 2,104 | 2,167 | 2,549 | 2,635 | 2,556 | 2,586 | 2,622 | 2,298 | 1,827 | 2,337 | 2,680 |
| 2019 | -- | -- | -- | -- | -- | -- | -- | -- | -- | -- | -- | -- |
| 2020 | -- | -- | -- | -- | -- | -- | -- | -- | -- | -- | -- | -- |
| 2021 | -- | -- | -- | -- | -- | -- | -- | -- | -- | -- | -- | |
| 2022 | -- | -- | -- | -- | -- | -- | -- | -- | -- | -- | -- | -- |
| 2023 | -- | -- | -- | -- | -- | -- | -- | -- | -- | -- | -- | -- |
| 2024 | -- | |||||||||||
| - = No Data Reported; -- = Not Applicable; NA = Not Available; W = Withheld to avoid disclosure of individual company data. |
| Release Date: 3/29/2024 |
| Next Release Date: 4/30/2024 |