|
Download Data (XLS File) |
|
||||||||
|
||||||||
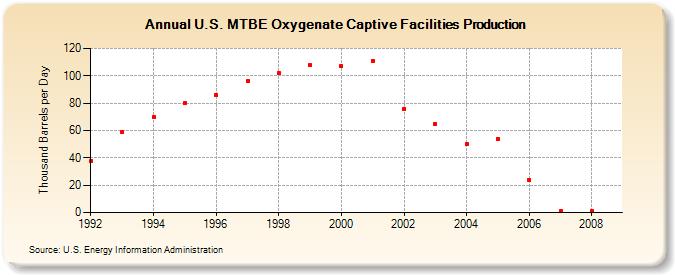
| U.S. MTBE Oxygenate Captive Facilities Production (Thousand Barrels per Day) | ||||||||
| Decade | Year-0 | Year-1 | Year-2 | Year-3 | Year-4 | Year-5 | Year-6 | Year-7 | Year-8 | Year-9 |
|---|---|---|---|---|---|---|---|---|---|---|
| 1990's | 38 | 59 | 70 | 80 | 86 | 96 | 102 | 108 | ||
| 2000's | 107 | 111 | 76 | 65 | 50 | 54 | 24 | 1 | 1 |
| - = No Data Reported; -- = Not Applicable; NA = Not Available; W = Withheld to avoid disclosure of individual company data. |
| Release Date: 3/29/2024 |
| Next Release Date: 8/30/2024 |