|
Download Data (XLS File) |
|
||||||||
|
||||||||
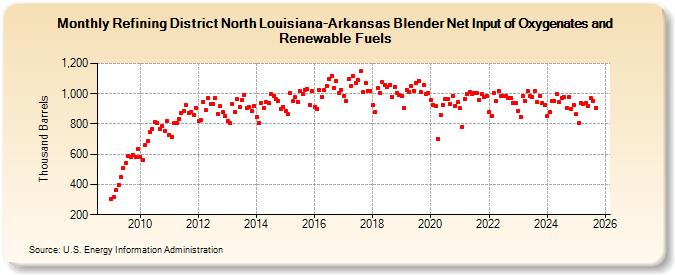
| Refining District North Louisiana-Arkansas Blender Net Input of Oxygenates and Renewable Fuels (Thousand Barrels) | ||||||||
| Year | Jan | Feb | Mar | Apr | May | Jun | Jul | Aug | Sep | Oct | Nov | Dec |
|---|---|---|---|---|---|---|---|---|---|---|---|---|
| 2009 | 307 | 314 | 363 | 396 | 447 | 508 | 545 | 590 | 580 | 597 | 582 | 634 |
| 2010 | 583 | 563 | 658 | 687 | 748 | 768 | 813 | 808 | 764 | 784 | 756 | 819 |
| 2011 | 726 | 715 | 807 | 807 | 836 | 872 | 887 | 923 | 870 | 881 | 858 | 908 |
| 2012 | 818 | 823 | 946 | 891 | 973 | 935 | 935 | 972 | 865 | 916 | 876 | 855 |
| 2013 | 819 | 806 | 933 | 880 | 967 | 912 | 958 | 993 | 904 | 909 | 885 | 918 |
| 2014 | 845 | 807 | 937 | 907 | 945 | 938 | 996 | 982 | 965 | 954 | 896 | 915 |
| 2015 | 888 | 863 | 1,006 | 950 | 977 | 947 | 1,019 | 1,001 | 1,027 | 1,029 | 927 | 1,017 |
| 2016 | 915 | 901 | 1,027 | 980 | 1,023 | 1,051 | 1,099 | 1,116 | 1,038 | 1,085 | 1,002 | 1,027 |
| 2017 | 984 | 953 | 1,098 | 1,053 | 1,118 | 1,070 | 1,093 | 1,148 | 1,011 | 1,071 | 1,017 | 1,019 |
| 2018 | 923 | 880 | 1,035 | 1,008 | 1,077 | 1,055 | 1,047 | 1,061 | 980 | 1,045 | 1,007 | 993 |
| 2019 | 982 | 903 | 1,023 | 1,012 | 1,053 | 1,021 | 1,071 | 1,087 | 1,009 | 1,059 | 999 | 1,003 |
| 2020 | 960 | 928 | 919 | 701 | 861 | 926 | 964 | 962 | 935 | 986 | 919 | 942 |
| 2021 | 903 | 782 | 962 | 1,001 | 1,012 | 1,000 | 1,006 | 1,008 | 959 | 996 | 981 | 985 |
| 2022 | 876 | 856 | 1,006 | 950 | 1,021 | 985 | 986 | 985 | 969 | 972 | 938 | 940 |
| 2023 | 889 | 849 | 983 | 954 | 1,020 | 982 | 978 | 1,020 | 946 | 983 | 938 | 928 |
| 2024 | 851 | |||||||||||
| - = No Data Reported; -- = Not Applicable; NA = Not Available; W = Withheld to avoid disclosure of individual company data. |
| Release Date: 3/29/2024 |
| Next Release Date: 4/30/2024 |