|
Download Data (XLS File) |
|
||||||||
|
||||||||
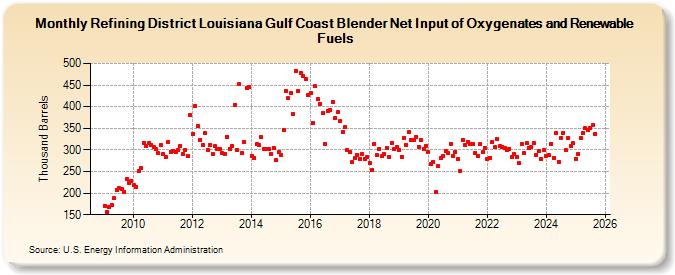
| Refining District Louisiana Gulf Coast Blender Net Input of Oxygenates and Renewable Fuels (Thousand Barrels) | ||||||||
| Year | Jan | Feb | Mar | Apr | May | Jun | Jul | Aug | Sep | Oct | Nov | Dec |
|---|---|---|---|---|---|---|---|---|---|---|---|---|
| 2009 | 171 | 156 | 167 | 172 | 188 | 208 | 211 | 209 | 203 | 233 | 224 | 229 |
| 2010 | 218 | 214 | 251 | 258 | 317 | 310 | 315 | 311 | 307 | 302 | 292 | 312 |
| 2011 | 290 | 284 | 318 | 296 | 298 | 294 | 300 | 310 | 290 | 299 | 286 | 381 |
| 2012 | 337 | 401 | 355 | 324 | 312 | 338 | 300 | 312 | 290 | 309 | 301 | 303 |
| 2013 | 292 | 291 | 331 | 303 | 310 | 404 | 300 | 452 | 293 | 319 | 444 | 445 |
| 2014 | 286 | 282 | 313 | 311 | 329 | 302 | 302 | 301 | 291 | 305 | 277 | 294 |
| 2015 | 288 | 346 | 436 | 419 | 432 | 382 | 482 | 436 | 478 | 470 | 465 | 426 |
| 2016 | 431 | 362 | 447 | 417 | 406 | 385 | 314 | 390 | 392 | 412 | 374 | 387 |
| 2017 | 366 | 342 | 353 | 300 | 295 | 271 | 281 | 288 | 280 | 291 | 280 | 284 |
| 2018 | 270 | 254 | 314 | 288 | 303 | 285 | 291 | 304 | 284 | 315 | 301 | 307 |
| 2019 | 299 | 284 | 327 | 312 | 341 | 324 | 322 | 330 | 307 | 323 | 302 | 310 |
| 2020 | 295 | 267 | 273 | 202 | 263 | 281 | 287 | 297 | 292 | 314 | 287 | 295 |
| 2021 | 280 | 252 | 324 | 311 | 319 | 313 | 314 | 293 | 285 | 313 | 294 | 305 |
| 2022 | 279 | 282 | 318 | 306 | 325 | 309 | 307 | 305 | 300 | 303 | 283 | 291 |
| 2023 | 283 | 269 | 314 | 292 | 316 | 304 | 306 | 315 | 289 | 298 | 279 | 299 |
| 2024 | 285 | 288 | 314 | 282 | ||||||||
| - = No Data Reported; -- = Not Applicable; NA = Not Available; W = Withheld to avoid disclosure of individual company data. |
| Release Date: 6/28/2024 |
| Next Release Date: 7/31/2024 |