|
Download Data (XLS File) |
|
||||||||
|
||||||||
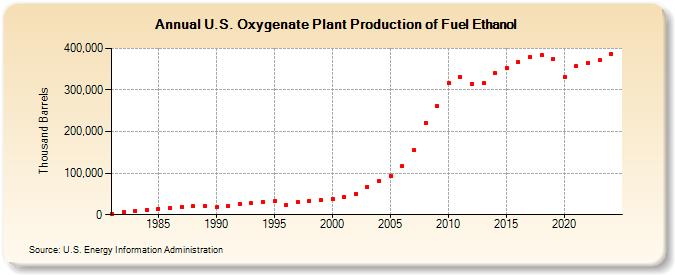
| U.S. Oxygenate Plant Production of Fuel Ethanol (Thousand Barrels) | ||||||||
| Decade | Year-0 | Year-1 | Year-2 | Year-3 | Year-4 | Year-5 | Year-6 | Year-7 | Year-8 | Year-9 |
|---|---|---|---|---|---|---|---|---|---|---|
| 1980's | 1,978 | 5,369 | 9,890 | 12,150 | 14,693 | 16,954 | 19,497 | 19,780 | 20,062 | |
| 1990's | 17,802 | 20,627 | 25,778 | 27,484 | 30,689 | 32,325 | 23,178 | 30,674 | 33,453 | 34,881 |
| 2000's | 38,627 | 42,028 | 50,956 | 66,772 | 81,009 | 92,961 | 116,294 | 155,263 | 221,637 | 260,424 |
| 2010's | 316,617 | 331,646 | 314,714 | 316,493 | 340,781 | 352,553 | 366,981 | 379,435 | 383,127 | 375,678 |
| 2020's | 331,928 | 357,517 | 365,731 | 371,895 |
| - = No Data Reported; -- = Not Applicable; NA = Not Available; W = Withheld to avoid disclosure of individual company data. |
| Release Date: 3/29/2024 |
| Next Release Date: 8/30/2024 |
Referring Pages: