|
Download Data (XLS File) |
|
||||||||
|
||||||||
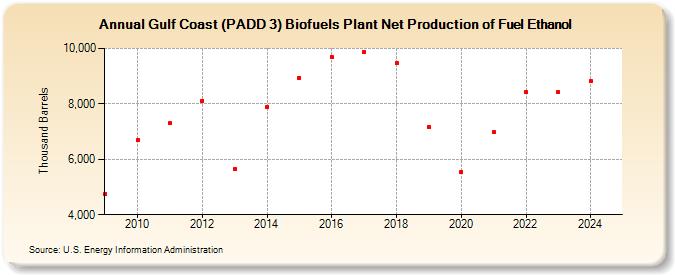
| Gulf Coast (PADD 3) Biofuels Plant Net Production of Fuel Ethanol (Thousand Barrels) | ||||||||
| Decade | Year-0 | Year-1 | Year-2 | Year-3 | Year-4 | Year-5 | Year-6 | Year-7 | Year-8 | Year-9 |
|---|---|---|---|---|---|---|---|---|---|---|
| 2000's | 4,741 | |||||||||
| 2010's | 6,688 | 7,294 | 8,120 | 5,632 | 7,885 | 8,944 | 9,681 | 9,862 | 9,457 | 7,165 |
| 2020's | 5,549 | 6,974 | 8,431 | 8,409 |
| - = No Data Reported; -- = Not Applicable; NA = Not Available; W = Withheld to avoid disclosure of individual company data. |
| Release Date: 3/29/2024 |
| Next Release Date: 8/30/2024 |