|
Download Data (XLS File) |
|
||||||||
|
||||||||
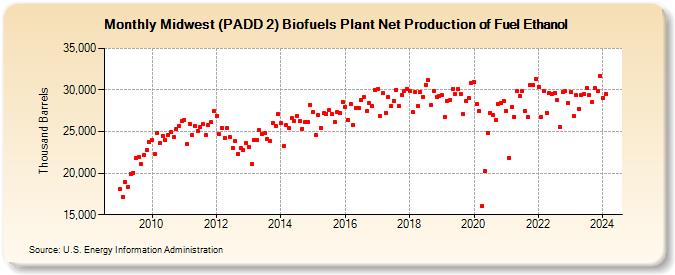
| Midwest (PADD 2) Biofuels Plant Net Production of Fuel Ethanol (Thousand Barrels) | ||||||||
| Year | Jan | Feb | Mar | Apr | May | Jun | Jul | Aug | Sep | Oct | Nov | Dec |
|---|---|---|---|---|---|---|---|---|---|---|---|---|
| 2009 | 18,084 | 17,172 | 18,990 | 18,350 | 19,920 | 20,074 | 21,801 | 21,967 | 21,079 | 22,176 | 22,788 | 23,717 |
| 2010 | 23,994 | 22,241 | 24,825 | 23,673 | 24,513 | 23,928 | 24,600 | 24,935 | 24,319 | 25,334 | 25,697 | 26,255 |
| 2011 | 26,399 | 23,477 | 25,955 | 24,598 | 25,676 | 25,060 | 25,489 | 25,893 | 24,642 | 25,833 | 26,094 | 27,422 |
| 2012 | 26,906 | 24,674 | 25,476 | 24,248 | 25,464 | 24,322 | 23,056 | 23,806 | 22,344 | 22,993 | 22,791 | 23,634 |
| 2013 | 23,157 | 21,089 | 23,961 | 24,005 | 25,209 | 24,689 | 24,786 | 24,145 | 23,810 | 26,040 | 25,697 | 27,083 |
| 2014 | 25,971 | 23,262 | 25,757 | 25,388 | 26,589 | 26,269 | 26,848 | 26,253 | 25,341 | 26,137 | 26,163 | 28,226 |
| 2015 | 27,303 | 24,557 | 26,957 | 25,457 | 27,186 | 27,166 | 27,549 | 27,169 | 26,119 | 27,351 | 27,181 | 28,527 |
| 2016 | 27,960 | 26,442 | 28,339 | 25,751 | 27,843 | 27,829 | 28,747 | 29,175 | 27,513 | 28,388 | 28,038 | 30,011 |
| 2017 | 30,143 | 26,837 | 29,661 | 27,261 | 29,199 | 28,128 | 28,687 | 30,054 | 28,048 | 29,415 | 29,891 | 30,151 |
| 2018 | 29,894 | 27,362 | 29,739 | 28,111 | 29,759 | 29,164 | 30,638 | 31,151 | 28,180 | 29,866 | 29,116 | 29,233 |
| 2019 | 29,377 | 26,735 | 28,704 | 28,828 | 30,136 | 29,544 | 30,123 | 29,519 | 27,095 | 28,654 | 29,067 | 30,855 |
| 2020 | 30,944 | 28,328 | 27,449 | 16,104 | 20,226 | 24,837 | 27,280 | 27,030 | 26,448 | 28,275 | 28,437 | 28,701 |
| 2021 | 27,473 | 21,874 | 27,915 | 26,785 | 29,843 | 29,266 | 29,826 | 27,468 | 26,722 | 30,572 | 30,645 | 31,306 |
| 2022 | 30,408 | 26,748 | 29,919 | 27,265 | 29,612 | 29,485 | 29,691 | 28,775 | 25,527 | 29,742 | 29,823 | 28,388 |
| 2023 | 29,738 | 26,854 | 29,366 | 27,756 | 29,382 | 29,459 | 30,247 | 29,383 | 28,612 | 30,220 | 29,845 | 31,726 |
| 2024 | 29,069 | |||||||||||
| - = No Data Reported; -- = Not Applicable; NA = Not Available; W = Withheld to avoid disclosure of individual company data. |
| Release Date: 3/29/2024 |
| Next Release Date: 4/30/2024 |