|
Download Data (XLS File) |
|
||||||||
|
||||||||
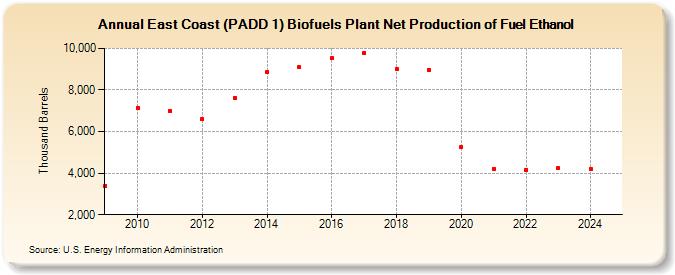
| East Coast (PADD 1) Biofuels Plant Net Production of Fuel Ethanol (Thousand Barrels) | ||||||||
| Decade | Year-0 | Year-1 | Year-2 | Year-3 | Year-4 | Year-5 | Year-6 | Year-7 | Year-8 | Year-9 |
|---|---|---|---|---|---|---|---|---|---|---|
| 2000's | 3,398 | |||||||||
| 2010's | 7,151 | 6,993 | 6,594 | 7,632 | 8,865 | 9,094 | 9,537 | 9,802 | 9,019 | 8,962 |
| 2020's | 5,244 | 4,213 | 4,174 | 4,238 |
| - = No Data Reported; -- = Not Applicable; NA = Not Available; W = Withheld to avoid disclosure of individual company data. |
| Release Date: 8/30/2024 |
| Next Release Date: 8/29/2025 |