|
Download Data (XLS File) |
|
||||||||
|
||||||||
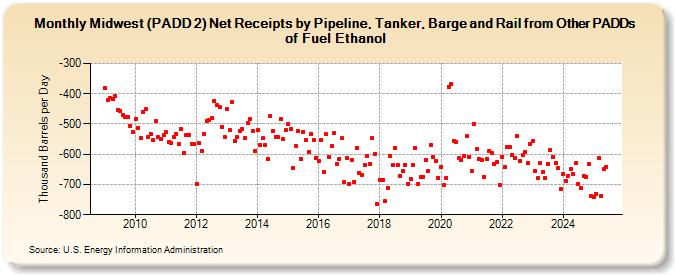
| Midwest (PADD 2) Net Receipts by Pipeline, Tanker, Barge and Rail from Other PADDs of Fuel Ethanol (Thousand Barrels per Day) | ||||||||
| Year | Jan | Feb | Mar | Apr | May | Jun | Jul | Aug | Sep | Oct | Nov | Dec |
|---|---|---|---|---|---|---|---|---|---|---|---|---|
| 2009 | -382 | -422 | -413 | -419 | -408 | -454 | -456 | -469 | -477 | -477 | -507 | -525 |
| 2010 | -485 | -513 | -547 | -459 | -452 | -543 | -532 | -554 | -490 | -544 | -549 | -537 |
| 2011 | -526 | -558 | -562 | -544 | -532 | -565 | -516 | -597 | -535 | -537 | -565 | -567 |
| 2012 | -697 | -562 | -588 | -533 | -490 | -488 | -480 | -423 | -438 | -444 | -509 | -543 |
| 2013 | -450 | -520 | -428 | -557 | -544 | -523 | -518 | -546 | -496 | -485 | -522 | -588 |
| 2014 | -520 | -571 | -547 | -571 | -615 | -475 | -523 | -542 | -544 | -483 | -550 | -520 |
| 2015 | -500 | -515 | -646 | -572 | -523 | -616 | -526 | -554 | -592 | -532 | -553 | -611 |
| 2016 | -621 | -552 | -659 | -534 | -610 | -573 | -531 | -631 | -615 | -548 | -691 | -612 |
| 2017 | -698 | -618 | -691 | -580 | -661 | -668 | -636 | -607 | -633 | -548 | -598 | -764 |
| 2018 | -684 | -684 | -756 | -711 | -607 | -636 | -580 | -634 | -671 | -657 | -634 | -698 |
| 2019 | -681 | -636 | -580 | -697 | -676 | -674 | -618 | -657 | -568 | -610 | -623 | -678 |
| 2020 | -643 | -702 | -677 | -377 | -368 | -556 | -560 | -614 | -618 | -607 | -540 | -608 |
| 2021 | -654 | -499 | -584 | -616 | -620 | -674 | -617 | -588 | -595 | -633 | -625 | -703 |
| 2022 | -608 | -642 | -576 | -576 | -602 | -613 | -540 | -622 | -604 | -594 | -630 | -565 |
| 2023 | -556 | -656 | -679 | -630 | -659 | -677 | -631 | -587 | -608 | -630 | -645 | -705 |
| 2024 | -665 | |||||||||||
| - = No Data Reported; -- = Not Applicable; NA = Not Available; W = Withheld to avoid disclosure of individual company data. |
| Release Date: 3/29/2024 |
| Next Release Date: 4/30/2024 |