|
Download Data (XLS File) |
|
||||||||
|
||||||||
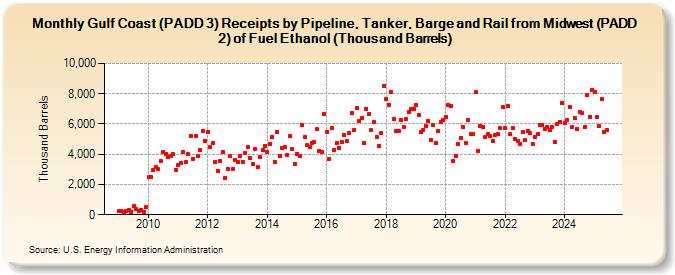
| Gulf Coast (PADD 3) Receipts by Pipeline, Tanker, Barge and Rail from Midwest (PADD 2) of Fuel Ethanol (Thousand Barrels) (Thousand Barrels) | ||||||||
| Year | Jan | Feb | Mar | Apr | May | Jun | Jul | Aug | Sep | Oct | Nov | Dec |
|---|---|---|---|---|---|---|---|---|---|---|---|---|
| 2009 | 245 | 216 | 158 | 276 | 280 | 188 | 549 | 362 | 263 | 308 | 185 | 480 |
| 2010 | 2,475 | 2,516 | 2,939 | 3,148 | 3,001 | 3,559 | 4,116 | 4,033 | 3,812 | 3,887 | 3,993 | 2,965 |
| 2011 | 3,280 | 3,428 | 4,152 | 3,455 | 4,007 | 5,232 | 3,710 | 5,233 | 3,864 | 4,294 | 5,528 | 4,868 |
| 2012 | 5,502 | 4,450 | 4,729 | 3,516 | 2,912 | 3,566 | 4,168 | 2,414 | 3,000 | 3,901 | 2,994 | 3,623 |
| 2013 | 3,466 | 3,893 | 3,472 | 4,112 | 4,462 | 3,772 | 3,360 | 4,357 | 3,124 | 3,830 | 4,279 | 4,557 |
| 2014 | 4,146 | 4,707 | 5,109 | 3,494 | 5,451 | 3,870 | 4,422 | 4,489 | 3,942 | 5,199 | 4,343 | 3,377 |
| 2015 | 4,035 | 3,907 | 5,925 | 5,129 | 4,580 | 4,475 | 4,713 | 4,788 | 5,668 | 4,246 | 4,117 | 6,659 |
| 2016 | 5,495 | 3,679 | 5,728 | 4,312 | 4,751 | 4,415 | 4,837 | 5,291 | 4,879 | 5,416 | 6,756 | 5,583 |
| 2017 | 7,027 | 6,177 | 6,385 | 4,768 | 7,023 | 6,670 | 5,591 | 6,099 | 5,160 | 4,553 | 5,386 | 8,544 |
| 2018 | 7,671 | 7,254 | 8,113 | 6,297 | 5,556 | 5,537 | 6,280 | 5,822 | 6,312 | 6,794 | 7,020 | 7,003 |
| 2019 | 7,282 | 6,611 | 5,456 | 5,609 | 5,876 | 6,212 | 4,958 | 5,941 | 4,728 | 5,555 | 6,134 | 6,256 |
| 2020 | 6,487 | 7,277 | 7,182 | 3,562 | 3,890 | 4,651 | 5,056 | 5,800 | 4,722 | 6,283 | 5,307 | 5,343 |
| 2021 | 8,109 | 4,200 | 5,894 | 5,824 | 5,109 | 5,336 | 5,222 | 4,846 | 5,271 | 5,329 | 5,713 | 7,090 |
| 2022 | 5,705 | 7,185 | 5,319 | 5,721 | 5,038 | 4,847 | 4,700 | 5,463 | 4,938 | 5,546 | 5,387 | 4,703 |
| 2023 | 5,151 | 5,308 | 5,961 | 5,960 | 5,668 | 5,805 | 5,602 | 5,772 | 4,836 | 5,989 | 6,132 | 7,373 |
| 2024 | 5,803 | |||||||||||
| - = No Data Reported; -- = Not Applicable; NA = Not Available; W = Withheld to avoid disclosure of individual company data. |
| Release Date: 3/29/2024 |
| Next Release Date: 4/30/2024 |