|
Download Data (XLS File) |
|
||||||||
|
||||||||
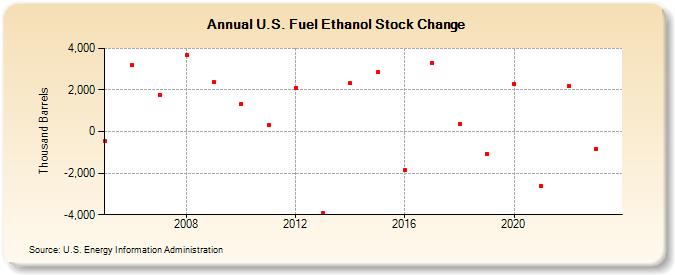
| U.S. Fuel Ethanol Stock Change (Thousand Barrels) | ||||||||
| Decade | Year-0 | Year-1 | Year-2 | Year-3 | Year-4 | Year-5 | Year-6 | Year-7 | Year-8 | Year-9 |
|---|---|---|---|---|---|---|---|---|---|---|
| 2000's | -439 | 3,197 | 1,775 | 3,691 | 2,368 | |||||
| 2010's | 1,347 | 297 | 2,112 | -3,926 | 2,315 | 2,857 | -1,838 | 3,285 | 375 | -1,066 |
| 2020's | 2,311 | -2,627 | 2,209 | -747 |
| - = No Data Reported; -- = Not Applicable; NA = Not Available; W = Withheld to avoid disclosure of individual company data. |
| Release Date: 8/30/2024 |
| Next Release Date: 8/29/2025 |
Referring Pages: