|
Download Data (XLS File) |
|
||||||||
|
||||||||
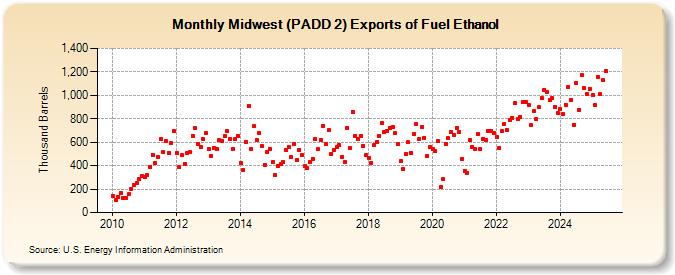
| Midwest (PADD 2) Exports of Fuel Ethanol (Thousand Barrels) | ||||||||
| Year | Jan | Feb | Mar | Apr | May | Jun | Jul | Aug | Sep | Oct | Nov | Dec |
|---|---|---|---|---|---|---|---|---|---|---|---|---|
| 2010 | 144 | 105 | 134 | 166 | 122 | 127 | 158 | 199 | 236 | 255 | 282 | 315 |
| 2011 | 303 | 319 | 392 | 495 | 421 | 475 | 625 | 518 | 609 | 512 | 592 | 694 |
| 2012 | 504 | 385 | 487 | 417 | 510 | 515 | 657 | 718 | 583 | 556 | 624 | 677 |
| 2013 | 543 | 485 | 551 | 539 | 615 | 609 | 651 | 693 | 629 | 539 | 631 | 656 |
| 2014 | 419 | 361 | 602 | 909 | 540 | 736 | 621 | 678 | 569 | 409 | 519 | 546 |
| 2015 | 428 | 324 | 398 | 410 | 431 | 532 | 562 | 474 | 581 | 449 | 537 | 491 |
| 2016 | 395 | 377 | 430 | 459 | 626 | 538 | 618 | 737 | 587 | 700 | 501 | 536 |
| 2017 | 556 | 573 | 473 | 430 | 725 | 548 | 861 | 656 | 629 | 657 | 571 | 487 |
| 2018 | 468 | 425 | 573 | 601 | 654 | 765 | 689 | 692 | 718 | 727 | 675 | 584 |
| 2019 | 438 | 371 | 500 | 598 | 512 | 669 | 755 | 627 | 731 | 639 | 481 | 563 |
| 2020 | 538 | 526 | 610 | 214 | 283 | 587 | 632 | 688 | 662 | 725 | 687 | 457 |
| 2021 | 358 | 341 | 617 | 563 | 544 | 674 | 545 | 631 | 618 | 694 | 696 | 677 |
| 2022 | 645 | 552 | 692 | 756 | 707 | 792 | 810 | 931 | 801 | 818 | 939 | 941 |
| 2023 | 941 | 766 | 888 | 801 | 913 | 1,000 | 1,062 | 1,042 | 976 | 991 | 928 | 850 |
| 2024 | 919 | 865 | 943 | 1,105 | ||||||||
| - = No Data Reported; -- = Not Applicable; NA = Not Available; W = Withheld to avoid disclosure of individual company data. |
| Release Date: 6/28/2024 |
| Next Release Date: 7/31/2024 |