|
Download Data (XLS File) |
|
||||||||
|
||||||||
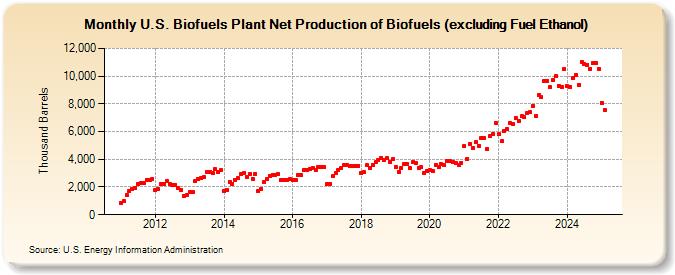
| U.S. Biofuels Plant Net Production of Biofuels (excluding Fuel Ethanol) (Thousand Barrels) | ||||||||
| Year | Jan | Feb | Mar | Apr | May | Jun | Jul | Aug | Sep | Oct | Nov | Dec |
|---|---|---|---|---|---|---|---|---|---|---|---|---|
| 2011 | 842 | 961 | 1,419 | 1,692 | 1,838 | 1,938 | 2,183 | 2,273 | 2,284 | 2,508 | 2,494 | 2,604 |
| 2012 | 1,751 | 1,887 | 2,251 | 2,237 | 2,428 | 2,223 | 2,127 | 2,176 | 1,949 | 1,792 | 1,363 | 1,406 |
| 2013 | 1,640 | 1,672 | 2,412 | 2,548 | 2,645 | 2,699 | 3,072 | 3,086 | 3,025 | 3,272 | 3,080 | 3,217 |
| 2014 | 1,727 | 1,801 | 2,361 | 2,223 | 2,531 | 2,645 | 2,926 | 2,987 | 2,754 | 2,928 | 2,610 | 2,958 |
| 2015 | 1,727 | 1,851 | 2,326 | 2,568 | 2,784 | 2,901 | 2,883 | 2,933 | 2,479 | 2,535 | 2,521 | 2,573 |
| 2016 | 2,490 | 2,504 | 2,861 | 2,856 | 3,222 | 3,205 | 3,331 | 3,385 | 3,206 | 3,433 | 3,408 | 3,425 |
| 2017 | 2,208 | 2,238 | 2,761 | 3,020 | 3,242 | 3,344 | 3,560 | 3,559 | 3,507 | 3,515 | 3,523 | 3,515 |
| 2018 | 2,989 | 3,046 | 3,551 | 3,393 | 3,603 | 3,783 | 3,960 | 4,102 | 3,914 | 4,070 | 3,816 | 3,995 |
| 2019 | 3,427 | 3,108 | 3,353 | 3,623 | 3,681 | 3,370 | 3,776 | 3,712 | 3,377 | 3,436 | 3,034 | 3,163 |
| 2020 | 3,196 | 3,139 | 3,594 | 3,422 | 3,630 | 3,590 | 3,849 | 3,872 | 3,790 | 3,743 | 3,621 | 3,761 |
| 2021 | 4,947 | 4,018 | 5,106 | 4,834 | 5,237 | 4,976 | 5,566 | 5,499 | 4,746 | 5,692 | 5,841 | 6,642 |
| 2022 | 5,797 | 5,312 | 6,036 | 6,181 | 6,585 | 6,579 | 7,013 | 6,797 | 7,087 | 7,022 | 7,352 | 7,390 |
| 2023 | 7,798 | 7,096 | 8,635 | 8,396 | 9,664 | 9,734 | 9,176 | 9,776 | 10,007 | 9,227 | 9,144 | 10,428 |
| 2024 | 9,274 | |||||||||||
| - = No Data Reported; -- = Not Applicable; NA = Not Available; W = Withheld to avoid disclosure of individual company data. |
| Release Date: 3/29/2024 |
| Next Release Date: 4/30/2024 |