|
Download Data (XLS File) |
|
||||||||
|
||||||||
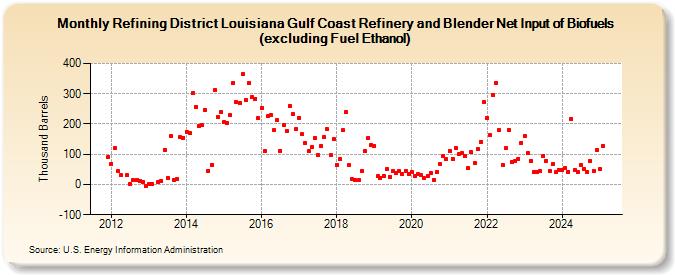
| Refining District Louisiana Gulf Coast Refinery and Blender Net Input of Biofuels (excluding Fuel Ethanol) (Thousand Barrels) | ||||||||
| Year | Jan | Feb | Mar | Apr | May | Jun | Jul | Aug | Sep | Oct | Nov | Dec |
|---|---|---|---|---|---|---|---|---|---|---|---|---|
| 2011 | 92 | |||||||||||
| 2012 | 69 | 119 | 43 | 30 | 31 | 1 | 14 | 14 | 13 | 7 | -6 | |
| 2013 | 1 | 1 | 8 | 12 | 115 | 22 | 159 | 16 | 18 | 156 | 155 | |
| 2014 | 175 | 170 | 302 | 257 | 194 | 195 | 246 | 46 | 66 | 313 | 223 | 238 |
| 2015 | 207 | 204 | 229 | 337 | 273 | 269 | 364 | 280 | 335 | 290 | 284 | 219 |
| 2016 | 253 | 109 | 226 | 230 | 179 | 212 | 112 | 196 | 178 | 261 | 232 | 183 |
| 2017 | 221 | 166 | 137 | 110 | 123 | 154 | 98 | 127 | 157 | 182 | 96 | 149 |
| 2018 | 66 | 83 | 179 | 240 | 63 | 17 | 14 | 14 | 45 | 109 | 153 | 130 |
| 2019 | 128 | 27 | 23 | 29 | 50 | 26 | 44 | 37 | 43 | 34 | 46 | 34 |
| 2020 | 42 | 29 | 33 | 30 | 21 | 28 | 38 | 15 | 40 | 67 | 95 | 83 |
| 2021 | 111 | 85 | 121 | 100 | 103 | 94 | 53 | 106 | 71 | 117 | 141 | 273 |
| 2022 | 221 | 162 | 295 | 335 | 179 | 65 | 119 | 180 | 74 | 77 | 85 | 138 |
| 2023 | 160 | 103 | 79 | 40 | 42 | 44 | 94 | 60 | 45 | 67 | 41 | 49 |
| 2024 | 48 | |||||||||||
| - = No Data Reported; -- = Not Applicable; NA = Not Available; W = Withheld to avoid disclosure of individual company data. |
| Release Date: 3/29/2024 |
| Next Release Date: 4/30/2024 |