|
Download Data (XLS File) |
|
||||||||
|
||||||||
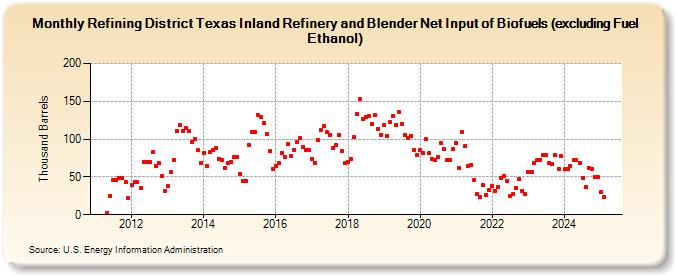
| Refining District Texas Inland Refinery and Blender Net Input of Biofuels (excluding Fuel Ethanol) (Thousand Barrels) | ||||||||
| Year | Jan | Feb | Mar | Apr | May | Jun | Jul | Aug | Sep | Oct | Nov | Dec |
|---|---|---|---|---|---|---|---|---|---|---|---|---|
| 2011 | 2 | 25 | 46 | 46 | 48 | 48 | 43 | 22 | ||||
| 2012 | 39 | 43 | 43 | 35 | 70 | 70 | 70 | 83 | 65 | 69 | 51 | 31 |
| 2013 | 38 | 56 | 73 | 111 | 118 | 111 | 115 | 111 | 96 | 100 | 85 | 69 |
| 2014 | 82 | 64 | 83 | 86 | 88 | 74 | 72 | 62 | 69 | 70 | 76 | 76 |
| 2015 | 54 | 44 | 45 | 92 | 109 | 109 | 132 | 129 | 121 | 107 | 84 | 61 |
| 2016 | 65 | 68 | 81 | 76 | 93 | 78 | 86 | 96 | 102 | 90 | 85 | 85 |
| 2017 | 74 | 69 | 99 | 112 | 117 | 110 | 106 | 88 | 92 | 106 | 84 | 69 |
| 2018 | 70 | 74 | 103 | 133 | 153 | 127 | 129 | 131 | 120 | 132 | 114 | 106 |
| 2019 | 119 | 104 | 123 | 130 | 119 | 136 | 120 | 105 | 102 | 104 | 86 | 79 |
| 2020 | 85 | 81 | 100 | 81 | 74 | 72 | 76 | 95 | 87 | 72 | 73 | 87 |
| 2021 | 95 | 62 | 109 | 91 | 65 | 66 | 46 | 27 | 24 | 39 | 26 | 33 |
| 2022 | 38 | 32 | 37 | 48 | 51 | 45 | 25 | 28 | 35 | 47 | 32 | 28 |
| 2023 | 56 | 57 | 68 | 72 | 73 | 79 | 79 | 68 | 67 | 79 | 61 | 77 |
| 2024 | 60 | 61 | 65 | 72 | 72 | 69 | ||||||
| - = No Data Reported; -- = Not Applicable; NA = Not Available; W = Withheld to avoid disclosure of individual company data. |
| Release Date: 8/30/2024 |
| Next Release Date: 9/30/2024 |