|
Download Data (XLS File) |
|
||||||||
|
||||||||
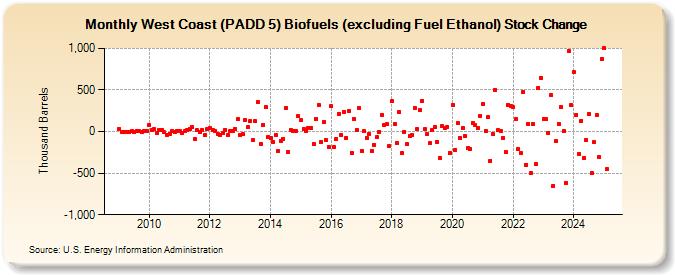
| West Coast (PADD 5) Biofuels (excluding Fuel Ethanol) Stock Change (Thousand Barrels) | ||||||||
| Year | Jan | Feb | Mar | Apr | May | Jun | Jul | Aug | Sep | Oct | Nov | Dec |
|---|---|---|---|---|---|---|---|---|---|---|---|---|
| 2009 | 36 | -1 | -2 | 0 | -8 | 2 | -2 | 9 | 2 | -2 | 7 | 1 |
| 2010 | 80 | 19 | 27 | -17 | 23 | 20 | -9 | -37 | -25 | 1 | -11 | 6 |
| 2011 | 4 | -12 | 3 | 19 | 32 | 54 | -87 | 15 | -10 | 21 | -43 | 35 |
| 2012 | 41 | 14 | 12 | -24 | -37 | -16 | 24 | -43 | 2 | 5 | 28 | 147 |
| 2013 | -43 | -35 | 134 | 50 | 121 | -102 | 121 | 354 | -148 | 83 | 298 | -67 |
| 2014 | -74 | -121 | -44 | -236 | -113 | -86 | 287 | -248 | 21 | 1 | 10 | 185 |
| 2015 | 135 | 29 | 5 | 47 | 47 | -145 | 155 | 321 | -122 | 115 | -107 | -187 |
| 2016 | 303 | -186 | -86 | 217 | -43 | 241 | -72 | 249 | -253 | 153 | 23 | 282 |
| 2017 | -231 | 4 | -77 | -28 | -232 | -158 | -66 | -2 | 204 | 77 | 86 | -175 |
| 2018 | 366 | 90 | -135 | 233 | -262 | -5 | -154 | -51 | -39 | 285 | 28 | 258 |
| 2019 | 369 | 25 | -31 | -142 | 20 | 56 | -123 | -316 | 64 | 45 | 52 | -254 |
| 2020 | 322 | -219 | 104 | -76 | 38 | -59 | -201 | -213 | 105 | 75 | 44 | 187 |
| 2021 | 334 | 9 | 171 | -349 | -35 | 502 | 15 | 9 | -73 | -240 | 325 | 306 |
| 2022 | 295 | 146 | -215 | -256 | 477 | -398 | 92 | -499 | 85 | -392 | 528 | 649 |
| 2023 | 91 | 200 | -96 | 472 | -619 | -171 | 165 | 293 | 2 | -615 | 962 | 328 |
| 2024 | 716 | |||||||||||
| - = No Data Reported; -- = Not Applicable; NA = Not Available; W = Withheld to avoid disclosure of individual company data. |
| Release Date: 3/29/2024 |
| Next Release Date: 4/30/2024 |