|
Download Data (XLS File) |
|
||||||||
|
||||||||
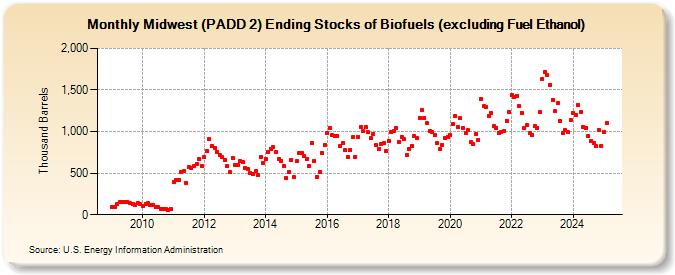
| Midwest (PADD 2) Ending Stocks of Biofuels (excluding Fuel Ethanol) (Thousand Barrels) | ||||||||
| Year | Jan | Feb | Mar | Apr | May | Jun | Jul | Aug | Sep | Oct | Nov | Dec |
|---|---|---|---|---|---|---|---|---|---|---|---|---|
| 2009 | 90 | 97 | 133 | 151 | 152 | 157 | 156 | 139 | 126 | 111 | 135 | 124 |
| 2010 | 104 | 129 | 136 | 120 | 117 | 91 | 87 | 72 | 72 | 70 | 60 | 71 |
| 2011 | 394 | 416 | 416 | 516 | 522 | 386 | 570 | 563 | 583 | 612 | 669 | 587 |
| 2012 | 688 | 763 | 911 | 831 | 808 | 755 | 717 | 692 | 659 | 584 | 513 | 685 |
| 2013 | 596 | 597 | 651 | 629 | 558 | 547 | 504 | 485 | 520 | 477 | 697 | 625 |
| 2014 | 671 | 755 | 787 | 815 | 756 | 664 | 644 | 584 | 441 | 513 | 660 | 450 |
| 2015 | 640 | 748 | 746 | 706 | 668 | 584 | 860 | 646 | 455 | 519 | 740 | 840 |
| 2016 | 982 | 1,046 | 953 | 951 | 948 | 823 | 862 | 776 | 699 | 784 | 929 | 698 |
| 2017 | 938 | 1,057 | 1,005 | 1,053 | 990 | 921 | 972 | 836 | 790 | 853 | 862 | 763 |
| 2018 | 885 | 993 | 1,001 | 1,045 | 879 | 938 | 908 | 724 | 796 | 831 | 949 | 917 |
| 2019 | 1,167 | 1,257 | 1,168 | 1,098 | 1,007 | 999 | 959 | 862 | 787 | 835 | 920 | 939 |
| 2020 | 964 | 1,087 | 1,186 | 1,049 | 1,157 | 1,046 | 982 | 1,013 | 871 | 847 | 971 | 904 |
| 2021 | 1,388 | 1,302 | 1,294 | 1,193 | 1,224 | 1,063 | 1,048 | 988 | 1,000 | 1,007 | 1,127 | 1,233 |
| 2022 | 1,440 | 1,418 | 1,429 | 1,310 | 1,227 | 1,044 | 1,076 | 982 | 960 | 1,063 | 1,048 | 1,230 |
| 2023 | 1,499 | 1,576 | 1,572 | 1,399 | 1,278 | 1,177 | 1,270 | 1,065 | 931 | 1,016 | 994 | 1,137 |
| 2024 | 1,220 | |||||||||||
| - = No Data Reported; -- = Not Applicable; NA = Not Available; W = Withheld to avoid disclosure of individual company data. |
| Release Date: 3/29/2024 |
| Next Release Date: 4/30/2024 |