|
Download Data (XLS File) |
|
||||||||
|
||||||||
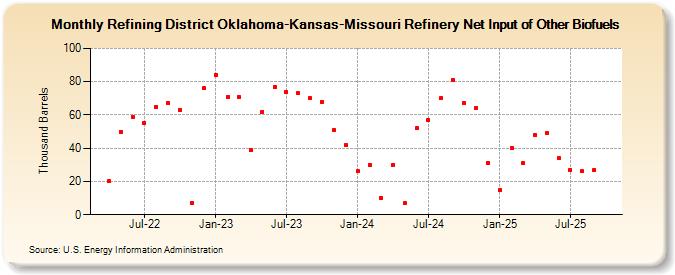
| Refining District Oklahoma-Kansas-Missouri Refinery Net Input of Other Biofuels (Thousand Barrels) | ||||||||
| Year | Jan | Feb | Mar | Apr | May | Jun | Jul | Aug | Sep | Oct | Nov | Dec |
|---|---|---|---|---|---|---|---|---|---|---|---|---|
| 2022 | 20 | 50 | 59 | 55 | 65 | 67 | 63 | 7 | 76 | |||
| 2023 | 84 | 71 | 71 | 39 | 62 | 77 | 74 | 73 | 70 | 68 | 51 | 42 |
| 2024 | 26 | 30 | 10 | 30 | ||||||||
| - = No Data Reported; -- = Not Applicable; NA = Not Available; W = Withheld to avoid disclosure of individual company data. |
| Release Date: 6/28/2024 |
| Next Release Date: 7/31/2024 |