|
Download Data (XLS File) |
|
||||||||
|
||||||||
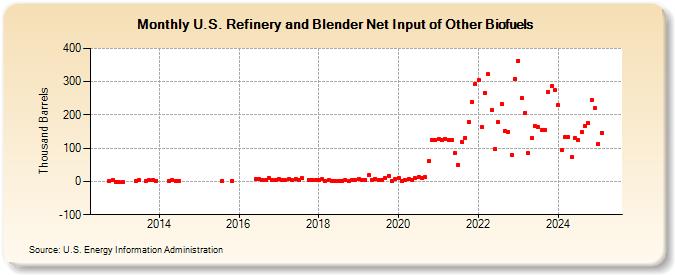
| U.S. Refinery and Blender Net Input of Other Biofuels (Thousand Barrels) | ||||||||
| Year | Jan | Feb | Mar | Apr | May | Jun | Jul | Aug | Sep | Oct | Nov | Dec |
|---|---|---|---|---|---|---|---|---|---|---|---|---|
| 2012 | 1 | 4 | -1 | |||||||||
| 2013 | -3 | -3 | 1 | 3 | 2 | 3 | 4 | 2 | ||||
| 2014 | 2 | 5 | 2 | 1 | ||||||||
| 2015 | 2 | 2 | ||||||||||
| 2016 | 7 | 6 | 5 | 4 | 11 | 5 | 5 | |||||
| 2017 | 8 | 5 | 4 | 6 | 4 | 8 | 5 | 9 | 5 | 5 | 5 | |
| 2018 | 3 | 6 | 1 | 3 | 2 | 2 | 2 | 2 | 4 | 2 | 3 | 5 |
| 2019 | 7 | 4 | 4 | 18 | 5 | 8 | 5 | 4 | 9 | 17 | 2 | 7 |
| 2020 | 10 | 2 | 4 | 7 | 4 | 9 | 13 | 10 | 13 | 61 | 126 | 124 |
| 2021 | 127 | 124 | 129 | 125 | 124 | 86 | 50 | 119 | 132 | 180 | 239 | 293 |
| 2022 | 304 | 163 | 267 | 322 | 215 | 97 | 178 | 234 | 152 | 150 | 80 | 308 |
| 2023 | 339 | 247 | 206 | 85 | 132 | 167 | 163 | 154 | 155 | 261 | 273 | 262 |
| 2024 | 229 | |||||||||||
| - = No Data Reported; -- = Not Applicable; NA = Not Available; W = Withheld to avoid disclosure of individual company data. |
| Release Date: 3/29/2024 |
| Next Release Date: 4/30/2024 |