|
Download Data (XLS File) |
|
||||||||
|
||||||||
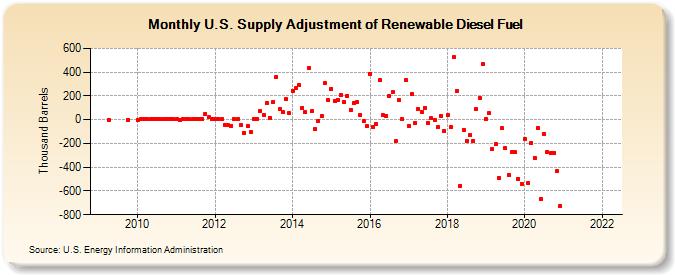
| U.S. Supply Adjustment of Renewable Diesel Fuel (Thousand Barrels) | ||||||||
| Year | Jan | Feb | Mar | Apr | May | Jun | Jul | Aug | Sep | Oct | Nov | Dec |
|---|---|---|---|---|---|---|---|---|---|---|---|---|
| 2009 | 0 | 0 | ||||||||||
| 2010 | 1 | 4 | 2 | 2 | 2 | 5 | 5 | 6 | 6 | 3 | 5 | 5 |
| 2011 | 5 | 1 | 2 | 2 | 3 | 3 | 3 | 4 | 4 | 51 | 19 | 4 |
| 2012 | 7 | 5 | 5 | -42 | -49 | -51 | 5 | 9 | -49 | -109 | -52 | -100 |
| 2013 | 8 | 8 | 70 | 42 | 137 | 17 | 150 | 361 | 89 | 62 | 173 | 54 |
| 2014 | 244 | 264 | 293 | 101 | 62 | 434 | 69 | -79 | -8 | 32 | 308 | 165 |
| 2015 | 262 | 160 | 168 | 209 | 152 | 202 | 84 | 143 | 148 | 42 | -14 | -57 |
| 2016 | 387 | -58 | -40 | 331 | 38 | 34 | 199 | 231 | -182 | 165 | 4 | 333 |
| 2017 | -50 | 219 | -26 | 94 | 68 | 100 | -24 | 10 | -1 | -65 | 30 | -92 |
| 2018 | 39 | -65 | 525 | 244 | -557 | -84 | -181 | -129 | -179 | 88 | 184 | 465 |
| 2019 | 5 | 52 | -249 | -207 | -490 | -74 | -241 | -463 | -276 | -275 | -498 | -541 |
| 2020 | -159 | -535 | -198 | -320 | -69 | -668 | -119 | -271 | -283 | -278 | -431 | -726 |
| 2022 | -- | |||||||||||
| - = No Data Reported; -- = Not Applicable; NA = Not Available; W = Withheld to avoid disclosure of individual company data. |
| Release Date: 3/29/2024 |
| Next Release Date: 4/30/2024 |
Referring Pages: