|
Download Data (XLS File) |
|
||||||||
|
||||||||
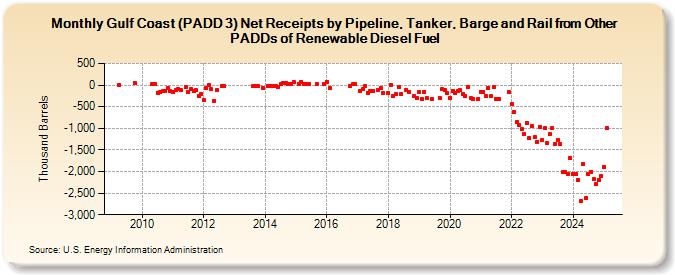
| Gulf Coast (PADD 3) Net Receipts by Pipeline, Tanker, Barge and Rail from Other PADDs of Renewable Diesel Fuel (Thousand Barrels) | ||||||||
| Year | Jan | Feb | Mar | Apr | May | Jun | Jul | Aug | Sep | Oct | Nov | Dec |
|---|---|---|---|---|---|---|---|---|---|---|---|---|
| 2009 | -4 | 54 | ||||||||||
| 2010 | 20 | 16 | -175 | -159 | -143 | -144 | -76 | -139 | ||||
| 2011 | -160 | -118 | -102 | -122 | -49 | -152 | -94 | -127 | -123 | -247 | -201 | |
| 2012 | -355 | -79 | 0 | -100 | -371 | -120 | -23 | -23 | ||||
| 2013 | -30 | -22 | -18 | -62 | ||||||||
| 2014 | -27 | -16 | -17 | -27 | -33 | 15 | 43 | 46 | 24 | 23 | 62 | |
| 2015 | 30 | 74 | 20 | 20 | 21 | 22 | 22 | |||||
| 2016 | 80 | -78 | -20 | 20 | 20 | |||||||
| 2017 | -130 | -97 | -28 | -176 | -135 | -129 | -103 | -73 | -189 | |||
| 2018 | -190 | 10 | -243 | -207 | -33 | -200 | -116 | -151 | -263 | -310 | ||
| 2019 | -169 | -311 | -153 | -310 | -314 | -309 | -95 | -121 | -191 | |||
| 2020 | -296 | -147 | -188 | -128 | -109 | -205 | -260 | -51 | -301 | -315 | -315 | |
| 2021 | -150 | -164 | -250 | -60 | -263 | -46 | -312 | -313 | -157 | |||
| 2022 | -441 | -618 | -862 | -934 | -1,024 | -1,126 | -872 | -1,232 | -950 | -1,212 | -1,311 | -964 |
| 2023 | -1,269 | -999 | -1,348 | -1,140 | -1,001 | -1,357 | -1,269 | -1,371 | -1,342 | -2,021 | -2,048 | -1,683 |
| 2024 | -2,052 | -2,064 | -2,189 | -2,640 | ||||||||
| - = No Data Reported; -- = Not Applicable; NA = Not Available; W = Withheld to avoid disclosure of individual company data. |
| Release Date: 6/28/2024 |
| Next Release Date: 7/31/2024 |