|
Download Data (XLS File) |
|
||||||||
|
||||||||
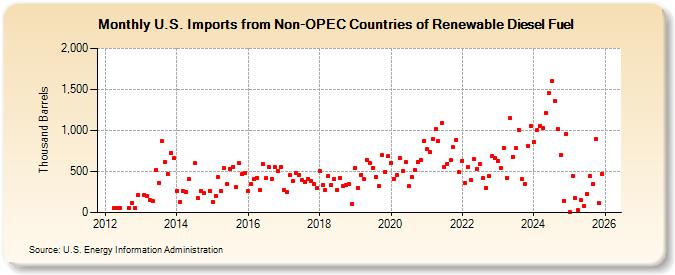
| U.S. Imports from Non-OPEC Countries of Renewable Diesel Fuel (Thousand Barrels) | ||||||||
| Year | Jan | Feb | Mar | Apr | May | Jun | Jul | Aug | Sep | Oct | Nov | Dec |
|---|---|---|---|---|---|---|---|---|---|---|---|---|
| 2012 | 50 | 55 | 58 | 56 | 114 | 57 | 215 | |||||
| 2013 | 218 | 196 | 148 | 136 | 523 | 365 | 866 | 613 | 467 | 728 | 661 | |
| 2014 | 267 | 133 | 267 | 247 | 409 | 603 | 178 | 267 | 235 | 267 | ||
| 2015 | 134 | 199 | 429 | 266 | 539 | 346 | 535 | 560 | 312 | 599 | 472 | 483 |
| 2016 | 258 | 345 | 413 | 420 | 275 | 586 | 419 | 555 | 411 | 554 | 511 | 557 |
| 2017 | 273 | 247 | 456 | 381 | 478 | 462 | 396 | 371 | 414 | 387 | 345 | 299 |
| 2018 | 506 | 337 | 275 | 446 | 340 | 403 | 278 | 424 | 324 | 341 | 344 | 106 |
| 2019 | 543 | 304 | 459 | 407 | 646 | 600 | 546 | 433 | 325 | 696 | 499 | 685 |
| 2020 | 605 | 411 | 452 | 664 | 505 | 615 | 318 | 435 | 517 | 617 | 645 | 874 |
| 2021 | 771 | 741 | 893 | 1,013 | 870 | 1,092 | 549 | 597 | 636 | 795 | 890 | 493 |
| 2022 | 632 | 359 | 555 | 392 | 649 | 536 | 593 | 421 | 304 | 441 | 692 | 670 |
| 2023 | 633 | 546 | 786 | 420 | 1,149 | 681 | 783 | 1,003 | 405 | 351 | 813 | 1,052 |
| 2024 | 855 | |||||||||||
| - = No Data Reported; -- = Not Applicable; NA = Not Available; W = Withheld to avoid disclosure of individual company data. |
| Release Date: 3/29/2024 |
| Next Release Date: 4/30/2024 |