|
Download Data (XLS File) |
|
||||||||
|
||||||||
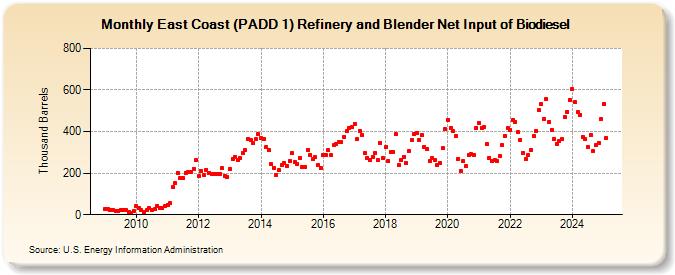
| East Coast (PADD 1) Refinery and Blender Net Input of Biodiesel (Thousand Barrels) | ||||||||
| Year | Jan | Feb | Mar | Apr | May | Jun | Jul | Aug | Sep | Oct | Nov | Dec |
|---|---|---|---|---|---|---|---|---|---|---|---|---|
| 2009 | 29 | 26 | 22 | 21 | 20 | 16 | 24 | 23 | 21 | 11 | 6 | 16 |
| 2010 | 41 | 33 | 21 | 12 | 21 | 30 | 24 | 26 | 43 | 32 | 30 | 40 |
| 2011 | 49 | 55 | 132 | 152 | 202 | 178 | 176 | 202 | 206 | 206 | 222 | 261 |
| 2012 | 184 | 212 | 192 | 217 | 200 | 198 | 198 | 197 | 196 | 223 | 187 | 182 |
| 2013 | 220 | 268 | 279 | 264 | 272 | 298 | 312 | 362 | 357 | 346 | 363 | 386 |
| 2014 | 367 | 362 | 324 | 311 | 242 | 226 | 192 | 213 | 240 | 248 | 235 | 258 |
| 2015 | 295 | 254 | 245 | 272 | 228 | 231 | 311 | 287 | 267 | 276 | 239 | 225 |
| 2016 | 286 | 289 | 309 | 286 | 333 | 340 | 348 | 349 | 375 | 401 | 417 | 420 |
| 2017 | 438 | 362 | 405 | 384 | 295 | 274 | 263 | 278 | 298 | 263 | 347 | 275 |
| 2018 | 324 | 257 | 301 | 301 | 386 | 237 | 261 | 280 | 248 | 306 | 358 | 387 |
| 2019 | 393 | 361 | 385 | 327 | 314 | 256 | 271 | 261 | 237 | 250 | 322 | 412 |
| 2020 | 457 | 419 | 401 | 378 | 269 | 211 | 257 | 233 | 286 | 290 | 287 | 418 |
| 2021 | 442 | 419 | 421 | 339 | 275 | 257 | 261 | 259 | 281 | 334 | 381 | 417 |
| 2022 | 408 | 457 | 447 | 396 | 359 | 299 | 266 | 286 | 312 | 379 | 403 | 503 |
| 2023 | 531 | 461 | 556 | 445 | 408 | 366 | 342 | 353 | 363 | 469 | 496 | 552 |
| 2024 | 604 | 542 | 494 | 482 | 376 | 362 | 328 | 382 | 305 | 334 | 345 | 459 |
| 2025 | 533 | 369 | 290 | 235 | ||||||||
| - = No Data Reported; -- = Not Applicable; NA = Not Available; W = Withheld to avoid disclosure of individual company data. |
| Release Date: 6/30/2025 |
| Next Release Date: 7/31/2025 |