|
Download Data (XLS File) |
|
||||||||
|
||||||||
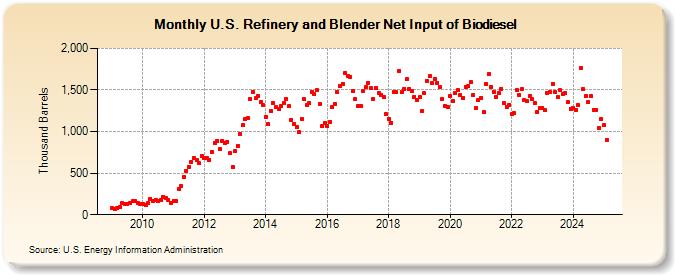
| U.S. Refinery and Blender Net Input of Biodiesel (Thousand Barrels) | ||||||||
| Year | Jan | Feb | Mar | Apr | May | Jun | Jul | Aug | Sep | Oct | Nov | Dec |
|---|---|---|---|---|---|---|---|---|---|---|---|---|
| 2009 | 79 | 73 | 79 | 93 | 136 | 125 | 133 | 146 | 160 | 160 | 146 | 127 |
| 2010 | 124 | 113 | 137 | 193 | 166 | 171 | 168 | 180 | 213 | 206 | 180 | 145 |
| 2011 | 168 | 166 | 305 | 342 | 457 | 531 | 577 | 635 | 683 | 659 | 616 | 710 |
| 2012 | 681 | 677 | 660 | 758 | 862 | 884 | 789 | 890 | 860 | 879 | 739 | 574 |
| 2013 | 764 | 831 | 975 | 1,078 | 1,149 | 1,159 | 1,391 | 1,481 | 1,400 | 1,432 | 1,354 | 1,317 |
| 2014 | 1,181 | 1,089 | 1,249 | 1,346 | 1,290 | 1,275 | 1,304 | 1,342 | 1,390 | 1,303 | 1,143 | 1,092 |
| 2015 | 1,053 | 990 | 1,154 | 1,387 | 1,316 | 1,342 | 1,474 | 1,448 | 1,497 | 1,329 | 1,063 | 1,104 |
| 2016 | 1,065 | 1,117 | 1,290 | 1,337 | 1,478 | 1,542 | 1,576 | 1,709 | 1,664 | 1,656 | 1,488 | 1,390 |
| 2017 | 1,302 | 1,303 | 1,489 | 1,531 | 1,585 | 1,525 | 1,392 | 1,524 | 1,461 | 1,445 | 1,411 | 1,208 |
| 2018 | 1,156 | 1,108 | 1,475 | 1,471 | 1,732 | 1,474 | 1,513 | 1,627 | 1,508 | 1,485 | 1,421 | 1,382 |
| 2019 | 1,410 | 1,246 | 1,460 | 1,613 | 1,668 | 1,581 | 1,629 | 1,587 | 1,530 | 1,390 | 1,312 | 1,299 |
| 2020 | 1,427 | 1,367 | 1,461 | 1,498 | 1,443 | 1,404 | 1,539 | 1,542 | 1,595 | 1,440 | 1,280 | 1,378 |
| 2021 | 1,405 | 1,233 | 1,572 | 1,690 | 1,535 | 1,480 | 1,421 | 1,460 | 1,512 | 1,340 | 1,301 | 1,325 |
| 2022 | 1,215 | 1,219 | 1,497 | 1,436 | 1,508 | 1,379 | 1,362 | 1,429 | 1,387 | 1,340 | 1,238 | 1,280 |
| 2023 | 1,273 | 1,227 | 1,509 | 1,462 | 1,563 | 1,467 | 1,415 | 1,479 | 1,437 | 1,449 | 1,339 | 1,271 |
| 2024 | 1,285 | |||||||||||
| - = No Data Reported; -- = Not Applicable; NA = Not Available; W = Withheld to avoid disclosure of individual company data. |
| Release Date: 3/29/2024 |
| Next Release Date: 4/30/2024 |