|
Download Data (XLS File) |
|
||||||||
|
||||||||
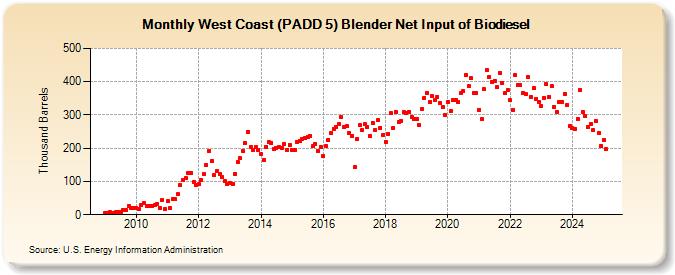
| West Coast (PADD 5) Blender Net Input of Biodiesel (Thousand Barrels) | ||||||||
| Year | Jan | Feb | Mar | Apr | May | Jun | Jul | Aug | Sep | Oct | Nov | Dec |
|---|---|---|---|---|---|---|---|---|---|---|---|---|
| 2009 | 4 | 4 | 7 | 5 | 7 | 7 | 7 | 13 | 13 | 26 | 20 | 19 |
| 2010 | 20 | 17 | 28 | 34 | 26 | 26 | 27 | 29 | 32 | 21 | 43 | 16 |
| 2011 | 40 | 20 | 46 | 46 | 61 | 89 | 104 | 111 | 125 | 126 | 99 | 90 |
| 2012 | 91 | 104 | 121 | 149 | 193 | 162 | 119 | 130 | 122 | 113 | 100 | 91 |
| 2013 | 96 | 93 | 122 | 159 | 169 | 192 | 217 | 249 | 205 | 195 | 203 | 196 |
| 2014 | 182 | 163 | 205 | 219 | 217 | 199 | 201 | 204 | 202 | 212 | 195 | 211 |
| 2015 | 194 | 194 | 219 | 223 | 228 | 232 | 235 | 238 | 206 | 214 | 191 | 203 |
| 2016 | 176 | 206 | 226 | 245 | 258 | 263 | 272 | 293 | 264 | 267 | 247 | 238 |
| 2017 | 142 | 227 | 269 | 255 | 272 | 263 | 238 | 277 | 255 | 285 | 261 | 241 |
| 2018 | 220 | 243 | 305 | 262 | 309 | 278 | 282 | 309 | 306 | 310 | 293 | 287 |
| 2019 | 287 | 269 | 318 | 352 | 367 | 339 | 356 | 345 | 355 | 335 | 325 | 301 |
| 2020 | 339 | 311 | 345 | 344 | 339 | 365 | 371 | 421 | 386 | 410 | 366 | 366 |
| 2021 | 316 | 289 | 377 | 435 | 415 | 398 | 403 | 383 | 427 | 396 | 365 | 374 |
| 2022 | 344 | 315 | 420 | 390 | 390 | 366 | 364 | 414 | 354 | 380 | 348 | 339 |
| 2023 | 327 | 333 | 392 | 355 | 386 | 325 | 309 | 339 | 340 | 364 | 330 | 268 |
| 2024 | 260 | |||||||||||
| - = No Data Reported; -- = Not Applicable; NA = Not Available; W = Withheld to avoid disclosure of individual company data. |
| Release Date: 3/29/2024 |
| Next Release Date: 4/30/2024 |
Referring Pages: