|
Download Data (XLS File) |
|
||||||||
|
||||||||
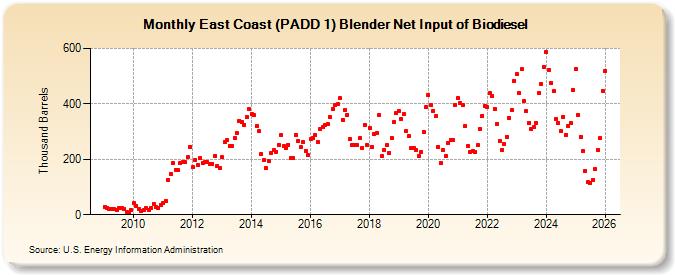
| East Coast (PADD 1) Blender Net Input of Biodiesel (Thousand Barrels) | ||||||||
| Year | Jan | Feb | Mar | Apr | May | Jun | Jul | Aug | Sep | Oct | Nov | Dec |
|---|---|---|---|---|---|---|---|---|---|---|---|---|
| 2009 | 29 | 26 | 22 | 21 | 20 | 16 | 24 | 23 | 21 | 11 | 6 | 16 |
| 2010 | 41 | 33 | 21 | 12 | 17 | 25 | 18 | 24 | 39 | 27 | 26 | 36 |
| 2011 | 44 | 50 | 126 | 147 | 187 | 163 | 160 | 185 | 190 | 189 | 207 | 246 |
| 2012 | 171 | 199 | 179 | 204 | 187 | 189 | 189 | 184 | 184 | 213 | 175 | 170 |
| 2013 | 207 | 263 | 269 | 248 | 249 | 277 | 293 | 339 | 334 | 325 | 352 | 380 |
| 2014 | 363 | 358 | 320 | 301 | 219 | 199 | 168 | 193 | 223 | 233 | 228 | 251 |
| 2015 | 288 | 247 | 239 | 253 | 204 | 205 | 288 | 267 | 244 | 261 | 230 | 216 |
| 2016 | 272 | 278 | 289 | 264 | 309 | 315 | 324 | 326 | 352 | 381 | 394 | 398 |
| 2017 | 420 | 343 | 378 | 360 | 272 | 251 | 251 | 252 | 275 | 242 | 324 | 253 |
| 2018 | 312 | 244 | 291 | 293 | 360 | 212 | 232 | 251 | 224 | 278 | 334 | 366 |
| 2019 | 374 | 345 | 363 | 301 | 284 | 241 | 241 | 235 | 212 | 226 | 300 | 388 |
| 2020 | 432 | 397 | 375 | 356 | 245 | 187 | 235 | 211 | 259 | 269 | 269 | 396 |
| 2021 | 420 | 402 | 394 | 320 | 247 | 228 | 231 | 227 | 250 | 310 | 357 | 392 |
| 2022 | 387 | 438 | 429 | 382 | 328 | 266 | 234 | 254 | 282 | 350 | 376 | 484 |
| 2023 | 506 | 438 | 524 | 410 | 373 | 332 | 308 | 317 | 326 | 438 | 473 | 532 |
| 2024 | 582 | |||||||||||
| - = No Data Reported; -- = Not Applicable; NA = Not Available; W = Withheld to avoid disclosure of individual company data. |
| Release Date: 3/29/2024 |
| Next Release Date: 4/30/2024 |
Referring Pages: