|
Download Data (XLS File) |
|
||||||||
|
||||||||
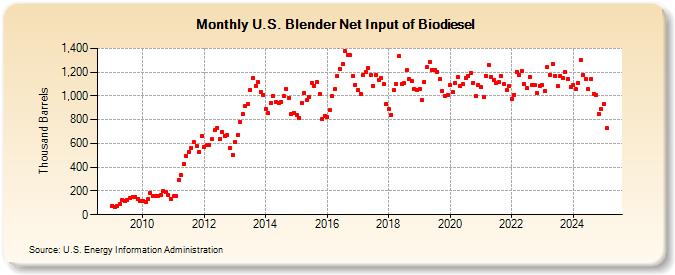
| U.S. Blender Net Input of Biodiesel (Thousand Barrels) | ||||||||
| Year | Jan | Feb | Mar | Apr | May | Jun | Jul | Aug | Sep | Oct | Nov | Dec |
|---|---|---|---|---|---|---|---|---|---|---|---|---|
| 2009 | 75 | 69 | 76 | 87 | 128 | 115 | 125 | 138 | 152 | 153 | 135 | 117 |
| 2010 | 118 | 107 | 130 | 185 | 154 | 157 | 154 | 170 | 201 | 190 | 167 | 134 |
| 2011 | 157 | 154 | 293 | 331 | 430 | 493 | 526 | 565 | 609 | 579 | 532 | 661 |
| 2012 | 573 | 587 | 588 | 637 | 710 | 732 | 638 | 697 | 665 | 671 | 565 | 504 |
| 2013 | 615 | 672 | 784 | 846 | 914 | 929 | 1,049 | 1,147 | 1,084 | 1,115 | 1,036 | 1,011 |
| 2014 | 892 | 854 | 942 | 1,001 | 946 | 941 | 952 | 997 | 1,057 | 984 | 851 | 860 |
| 2015 | 842 | 816 | 942 | 1,028 | 965 | 989 | 1,110 | 1,086 | 1,121 | 1,017 | 804 | 832 |
| 2016 | 820 | 878 | 998 | 1,056 | 1,167 | 1,226 | 1,265 | 1,374 | 1,344 | 1,342 | 1,166 | 1,094 |
| 2017 | 1,049 | 1,016 | 1,177 | 1,201 | 1,232 | 1,174 | 1,086 | 1,178 | 1,134 | 1,149 | 1,100 | 931 |
| 2018 | 891 | 842 | 1,051 | 1,097 | 1,333 | 1,102 | 1,107 | 1,215 | 1,140 | 1,122 | 1,057 | 1,051 |
| 2019 | 1,059 | 965 | 1,121 | 1,242 | 1,286 | 1,221 | 1,219 | 1,204 | 1,140 | 1,045 | 1,002 | 1,008 |
| 2020 | 1,089 | 1,037 | 1,107 | 1,158 | 1,087 | 1,097 | 1,151 | 1,164 | 1,195 | 1,112 | 997 | 1,095 |
| 2021 | 1,077 | 992 | 1,171 | 1,264 | 1,158 | 1,134 | 1,106 | 1,116 | 1,169 | 1,100 | 1,048 | 1,082 |
| 2022 | 974 | 1,010 | 1,202 | 1,178 | 1,209 | 1,097 | 1,063 | 1,162 | 1,096 | 1,088 | 1,025 | 1,087 |
| 2023 | 1,081 | 1,010 | 1,286 | 1,171 | 1,258 | 1,156 | 1,082 | 1,155 | 1,138 | 1,189 | 1,130 | 1,069 |
| 2024 | 1,090 | |||||||||||
| - = No Data Reported; -- = Not Applicable; NA = Not Available; W = Withheld to avoid disclosure of individual company data. |
| Release Date: 3/29/2024 |
| Next Release Date: 4/30/2024 |
Referring Pages: