|
Download Data (XLS File) |
|
||||||||
|
||||||||
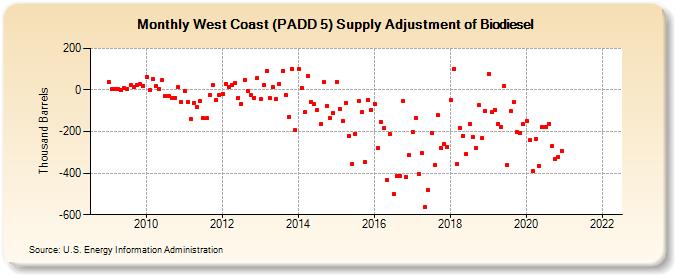
| West Coast (PADD 5) Supply Adjustment of Biodiesel (Thousand Barrels) | ||||||||
| Year | Jan | Feb | Mar | Apr | May | Jun | Jul | Aug | Sep | Oct | Nov | Dec |
|---|---|---|---|---|---|---|---|---|---|---|---|---|
| 2009 | 40 | 3 | 5 | 5 | -1 | 9 | 5 | 22 | 15 | 24 | 27 | 20 |
| 2010 | 62 | -2 | 55 | 17 | 4 | 46 | -28 | -31 | -39 | -37 | 13 | -57 |
| 2011 | -4 | -59 | -142 | -62 | -81 | -54 | -137 | -137 | -24 | 22 | -47 | -24 |
| 2012 | -18 | 29 | 12 | 24 | 34 | -38 | -66 | 48 | -5 | -25 | -37 | 57 |
| 2013 | -43 | 22 | 92 | -40 | 12 | -44 | 29 | 93 | -25 | -128 | 103 | -193 |
| 2014 | 102 | 11 | -108 | 69 | -57 | -69 | -96 | -166 | 37 | -75 | -135 | -113 |
| 2015 | 40 | -90 | -148 | -62 | -222 | -356 | -210 | -55 | -107 | -345 | -48 | -94 |
| 2016 | -66 | -280 | -154 | -183 | -433 | -212 | -498 | -416 | -414 | -55 | -419 | -314 |
| 2017 | -201 | -133 | -402 | -305 | -563 | -482 | -205 | -361 | -122 | -279 | -262 | -275 |
| 2018 | -49 | 103 | -357 | -185 | -220 | -308 | -162 | -224 | -280 | -74 | -230 | -102 |
| 2019 | 78 | -107 | -94 | -164 | -180 | 18 | -362 | -102 | -57 | -203 | -205 | -165 |
| 2020 | -147 | -241 | -390 | -234 | -366 | -179 | -178 | -162 | -269 | -333 | -321 | -292 |
| 2022 | -- | |||||||||||
| - = No Data Reported; -- = Not Applicable; NA = Not Available; W = Withheld to avoid disclosure of individual company data. |
| Release Date: 3/29/2024 |
| Next Release Date: 4/30/2024 |