|
Download Data (XLS File) |
|
||||||||
|
||||||||
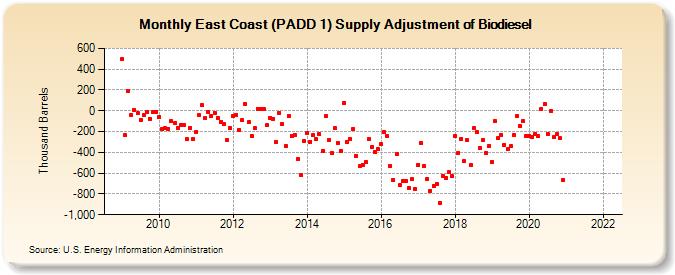
| East Coast (PADD 1) Supply Adjustment of Biodiesel (Thousand Barrels) | ||||||||
| Year | Jan | Feb | Mar | Apr | May | Jun | Jul | Aug | Sep | Oct | Nov | Dec |
|---|---|---|---|---|---|---|---|---|---|---|---|---|
| 2009 | 497 | -237 | 190 | -36 | 8 | -26 | -85 | -43 | -16 | -75 | -15 | -11 |
| 2010 | -59 | -179 | -169 | -172 | -102 | -118 | -169 | -140 | -138 | -276 | -163 | -267 |
| 2011 | -200 | -43 | 53 | -68 | -10 | -47 | -20 | -67 | -105 | -124 | -280 | -170 |
| 2012 | -55 | -39 | -181 | -91 | 67 | -110 | -238 | -170 | 21 | 18 | 14 | -140 |
| 2013 | -66 | -77 | -302 | -19 | -128 | -339 | -46 | -238 | -233 | -464 | -616 | -290 |
| 2014 | -210 | -296 | -235 | -273 | -227 | -388 | -53 | -279 | -407 | -170 | -306 | -385 |
| 2015 | 75 | -299 | -272 | -173 | -436 | -536 | -517 | -490 | -273 | -348 | -393 | -368 |
| 2016 | -324 | -203 | -245 | -530 | -668 | -418 | -718 | -677 | -673 | -743 | -659 | -755 |
| 2017 | -520 | -312 | -536 | -654 | -774 | -721 | -703 | -884 | -623 | -643 | -593 | -631 |
| 2018 | -244 | -405 | -268 | -485 | -285 | -525 | -170 | -209 | -359 | -277 | -406 | -339 |
| 2019 | -489 | -100 | -265 | -233 | -329 | -368 | -342 | -230 | -55 | -143 | -101 | -247 |
| 2020 | -244 | -248 | -222 | -247 | 19 | 63 | -222 | -4 | -254 | -226 | -265 | -666 |
| 2022 | -- | |||||||||||
| - = No Data Reported; -- = Not Applicable; NA = Not Available; W = Withheld to avoid disclosure of individual company data. |
| Release Date: 3/29/2024 |
| Next Release Date: 4/30/2024 |