|
Download Data (XLS File) |
|
||||||||
|
||||||||
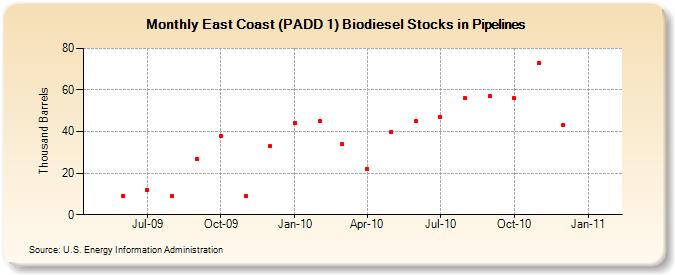
| East Coast (PADD 1) Biodiesel Stocks in Pipelines (Thousand Barrels) | ||||||||
| Year | Jan | Feb | Mar | Apr | May | Jun | Jul | Aug | Sep | Oct | Nov | Dec |
|---|---|---|---|---|---|---|---|---|---|---|---|---|
| 2009 | 9 | 12 | 9 | 27 | 38 | 9 | 33 | |||||
| 2010 | 44 | 45 | 34 | 22 | 40 | 45 | 47 | 56 | 57 | 56 | 73 | 43 |
| 2011 | 45 | 66 | 60 | 60 | 68 | 70 | 61 | 64 | 61 | 71 | 76 | 96 |
| 2012 | 88 | 121 | 153 | 175 | ||||||||
| - = No Data Reported; -- = Not Applicable; NA = Not Available; W = Withheld to avoid disclosure of individual company data. |
| Release Date: 3/29/2024 |
| Next Release Date: 4/30/2024 |