|
Download Data (XLS File) |
|
||||||||
|
||||||||
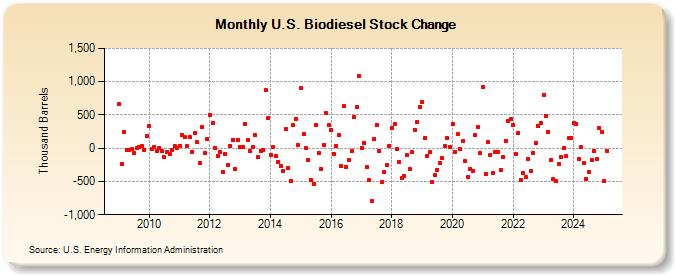
| U.S. Biodiesel Stock Change (Thousand Barrels) | ||||||||
| Year | Jan | Feb | Mar | Apr | May | Jun | Jul | Aug | Sep | Oct | Nov | Dec |
|---|---|---|---|---|---|---|---|---|---|---|---|---|
| 2009 | 664 | -240 | 241 | -33 | -32 | -19 | -70 | 0 | 16 | 26 | -22 | 180 |
| 2010 | 338 | -10 | 18 | -48 | 7 | -48 | -138 | -59 | -89 | -32 | 26 | -4 |
| 2011 | 39 | 201 | 164 | 27 | 168 | -53 | 224 | 86 | -216 | 320 | -72 | 139 |
| 2012 | 499 | 384 | -1 | -114 | -63 | -362 | -86 | -250 | 37 | 127 | -314 | 123 |
| 2013 | 18 | 24 | 364 | 117 | -47 | 25 | 198 | -134 | -40 | -26 | 877 | 450 |
| 2014 | -101 | 18 | -122 | -202 | -267 | -337 | 291 | -304 | -492 | 347 | 444 | 46 |
| 2015 | 902 | 212 | 0 | -173 | -471 | -536 | 341 | -71 | -312 | 48 | 530 | 343 |
| 2016 | 279 | -89 | 34 | 192 | -268 | 635 | -283 | -177 | -38 | 463 | 624 | 1,083 |
| 2017 | 0 | 78 | -286 | -484 | -797 | 144 | 353 | -49 | -507 | -364 | -252 | 35 |
| 2018 | 297 | 369 | -9 | -209 | -441 | -425 | -107 | -318 | -54 | 276 | 392 | 623 |
| 2019 | 692 | 148 | -113 | -59 | -515 | -406 | -321 | -228 | -154 | 32 | 149 | 20 |
| 2020 | 367 | -54 | 209 | -18 | 102 | -195 | -439 | -316 | -342 | 197 | 323 | -76 |
| 2021 | 915 | -391 | 94 | -101 | -379 | -57 | -51 | -328 | -139 | 110 | 407 | 441 |
| 2022 | 356 | -86 | 234 | -479 | -373 | -435 | -164 | -347 | -67 | 77 | 329 | 376 |
| 2023 | 698 | 564 | 194 | -209 | -433 | -435 | -259 | -130 | -13 | -61 | 160 | 153 |
| 2024 | 378 | |||||||||||
| - = No Data Reported; -- = Not Applicable; NA = Not Available; W = Withheld to avoid disclosure of individual company data. |
| Release Date: 3/29/2024 |
| Next Release Date: 4/30/2024 |
Referring Pages: