|
Download Data (XLS File) |
|
||||||||
|
||||||||
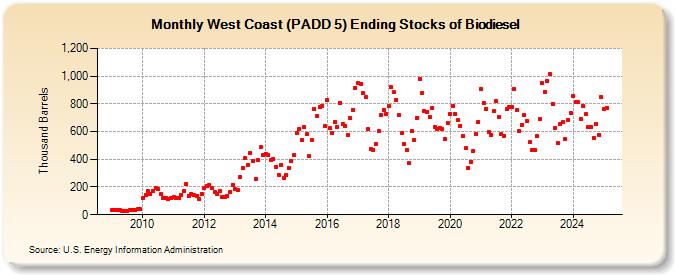
| West Coast (PADD 5) Ending Stocks of Biodiesel (Thousand Barrels) | ||||||||
| Year | Jan | Feb | Mar | Apr | May | Jun | Jul | Aug | Sep | Oct | Nov | Dec |
|---|---|---|---|---|---|---|---|---|---|---|---|---|
| 2009 | 36 | 35 | 33 | 33 | 25 | 27 | 25 | 34 | 36 | 34 | 41 | 42 |
| 2010 | 122 | 141 | 168 | 151 | 174 | 194 | 185 | 148 | 123 | 124 | 113 | 119 |
| 2011 | 129 | 117 | 120 | 139 | 171 | 225 | 138 | 153 | 143 | 138 | 111 | 150 |
| 2012 | 191 | 205 | 217 | 190 | 163 | 147 | 171 | 128 | 130 | 135 | 163 | 217 |
| 2013 | 189 | 175 | 270 | 340 | 407 | 358 | 446 | 387 | 260 | 395 | 486 | 432 |
| 2014 | 441 | 428 | 396 | 401 | 347 | 288 | 358 | 263 | 290 | 340 | 386 | 432 |
| 2015 | 591 | 619 | 539 | 631 | 580 | 422 | 537 | 764 | 713 | 775 | 785 | 640 |
| 2016 | 825 | 623 | 586 | 672 | 633 | 808 | 653 | 638 | 573 | 698 | 759 | 917 |
| 2017 | 949 | 942 | 875 | 847 | 615 | 471 | 466 | 509 | 601 | 721 | 759 | 729 |
| 2018 | 782 | 920 | 883 | 829 | 718 | 586 | 509 | 467 | 372 | 602 | 538 | 701 |
| 2019 | 981 | 878 | 745 | 743 | 706 | 768 | 632 | 620 | 626 | 616 | 549 | 663 |
| 2020 | 728 | 785 | 730 | 681 | 643 | 571 | 481 | 339 | 383 | 461 | 585 | 672 |
| 2021 | 909 | 804 | 765 | 598 | 576 | 751 | 818 | 704 | 583 | 571 | 761 | 776 |
| 2022 | 775 | 906 | 753 | 602 | 647 | 719 | 674 | 524 | 464 | 467 | 566 | 687 |
| 2023 | 948 | 959 | 963 | 1,015 | 803 | 627 | 520 | 651 | 666 | 546 | 680 | 733 |
| 2024 | 858 | |||||||||||
| - = No Data Reported; -- = Not Applicable; NA = Not Available; W = Withheld to avoid disclosure of individual company data. |
| Release Date: 3/29/2024 |
| Next Release Date: 4/30/2024 |